How Glass Lewis improved their executive compensation analysis and Say on Pay recommendations for European markets

Andrew Gebelin from Glass Lewis talks through how he and his team of analysts have benefited from using the CGLytics data and tools to improve their executive compensation analysis and Say on Pay recommendations for European markets.

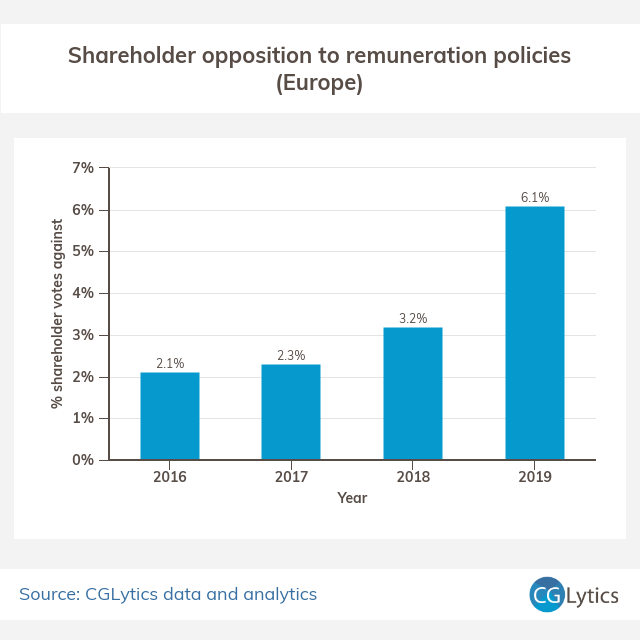
In the continuously evolving and sometimes volatile economic times, investors have to make tough decisions. To ensure they are making the best possible decisions they require greater insights into activities within portfolios. Whether it’s sustainability practices, gender and cultural diversity, or executive compensation and remuneration, Glass Lewis has experienced, first-hand, the increasing demand for additional information from their investor clients.

CHALLENGE

Glass Lewis had a vision to create the next generation version of their quantitative pay and peer analysis, which they include in their Proxy Papers for annual shareholder meetings. Their approach to proxy advising focuses on providing investor clients with independent, in-depth analysis that looks at each company on a case-by-case basis. When it comes to executive pay, regardless of the company’s size or sector, Glass Lewis’ methodology requires a contextual assessment incorporating two consistent peer comparisons: one against similarly sized peers in the same country, and the other against a wider geographic pool of companies in the same industry.

Prior to the partnership with CGLytics, Glass Lewis’ analysis of the relationship between executive pay and performance within the European market was limited by the quantitative pay and peer tools they had available. With their client investors expecting increasingly detailed evaluations of an
ever-wider pool of companies, Glass Lewis realized that achieving their vision would require tools that provide:

  • • Greater flexibility to model unique peer groups;
  • • An ability to view CEO pay comparisons over different time periods that appropriately reflect a company’s business cycle or performance period;
  • • Comparisons incorporating a larger range of key performance indicators and remuneration metrics, allowing deep-dives into individual pay practices;
  • • Flexibility to consider and make comparisons between grant-date, target and realized pay over different time periods; and
  • • The ability to model differences in pay outcomes based on any changes contemplated to the remuneration framework or metrics.
  • APPROACH

    For the 2018 proxy season Glass Lewis integrated CGLytics data and analytics into their analytical processes and Proxy Papers for the European markets.

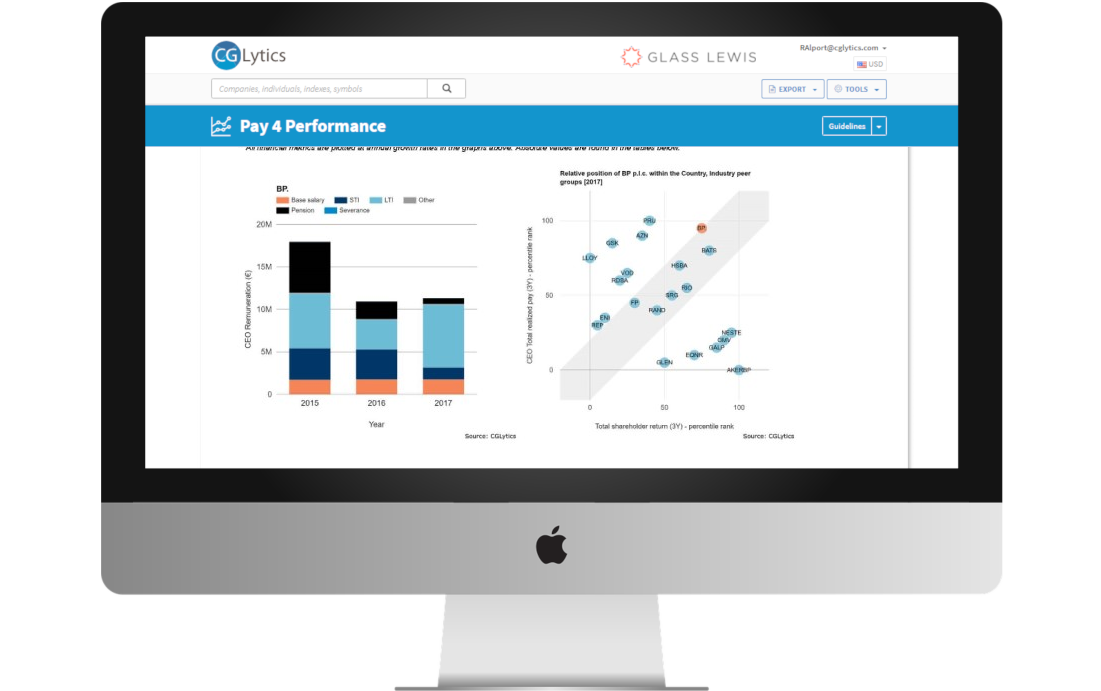
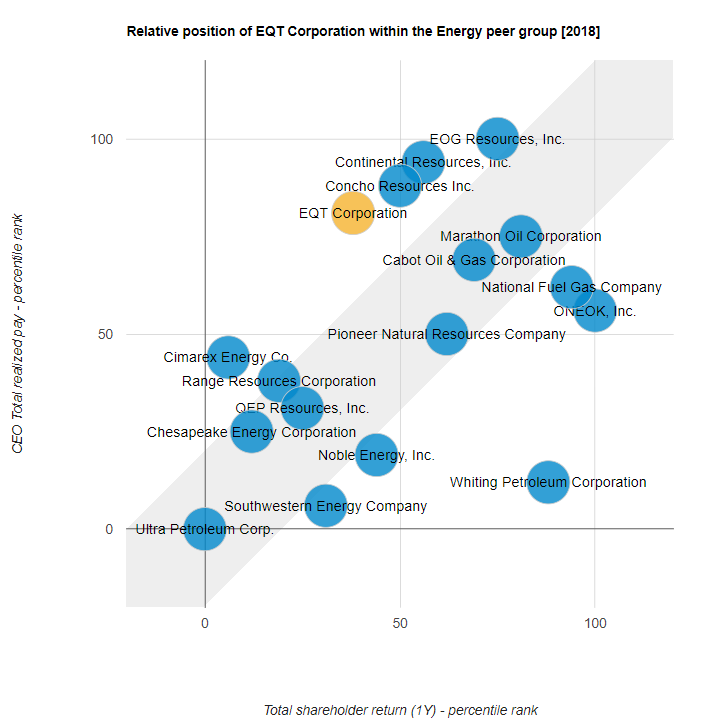
    Working with CGLytics, Glass Lewis defined a new peer group methodology focused around two distinct comparator groups:cross-border industry groups, and in-country groups based on company size. These peer groups were proofed and refined with CGLytics’ support to ensure they provide an appropriate basis of comparison. Glass Lewis analysts then incorporated key metrics from CGLytics’ rich library of performance data, displayed against three years of realized pay to allow for a balanced assessment over the longer term.

    CGLytics’ platform allowed Glass Lewis to provide their clients with a standardized approach to pay analytics across Europe, while retaining flexibility to account for market-, company- or plan-specific features. The performance metrics included in the Proxy Paper analysis were chosen for the greatest possible consistency across all European listed companies, providing a common point of comparison regardless of market or sector. That said, not all companies (or pay plans) are alike. Where unique circumstances require bespoke pay analytics using different indicators or uniquely designed peer groups, access to the CGLytics SaaS platform allows Glass Lewis analysts to drilldown and perform a multitude of quantitative  comparisons and tests.
    With the new peer group methodology in place, CGLytics helped Glass Lewis develop a graphical layout that illustrates the relationship between pay and performance. The new Remuneration Analysis section within the Proxy Paper
    incorporates peer comparisons and a breakdown of remuneration components to present a comprehensive picture, allowing investors to assess pay outcomes on both a relative and absolute basis.

    SUCCESS

    Incorporating CGLytics compensation data and analytics into Glass Lewis’ Proxy Paper and voting recommendations has yielded overwhelmingly positive feedback from investor clients and from companies.

    By implementing a standardized display that allows every company to be compared on a like-for-like basis, while retaining the flexibility to utilize an array of customized key performance metrics, CGLytics and Glass Lewis developed the tools to produce quantitative pay analysis and peer comparisons that are second-to-none. Investors appreciate the easy access to CGLytics rich data and powerful tools, yielding valuable remuneration insights whether they are comparing the entire market or diving deep into a single pay plan. For the companies that Glass Lewis covers, the use of bespoke peer groups and the sheer range of options that can be customized provide reassurance that their company’s pay policies will be assessed appropriately.


    BENEFITS OF IMPLEMENTING CGLYTICS’ DATA AND ANALYTICS

    Analysts can access 10+ years of historical compensation data
    Glass Lewis analysts are able to both view historical pay practices over an extended horizon, and model the anticipated future impact of new pay policies.

    Comparison of pay practices on a like-for-like basis
    Standardized display options for every company across Europe supports greater consistency when comparing pay practices across industries and regions.

    Greater flexibility to analyze information beyond Proxy Papers
    Analysts can now use CGLytics SaaS platform to look at specific remuneration components and factors outside of the standard information displayed in Proxy Papers.

    Expanded European market coverage
    Glass Lewis expanded their European market with additional indexes and 200+ companies to cover more than 1,100 companies.

    50% time-savings when generating quantitative pay analysis
    Using graphical templates and standardized data, analysts were able to complete the
    quantatitive pay component of the Proxy Paper in half the time compared to prior years.

    Empowered investor clients to customize their own pay for performance analysis Glass Lewis clients have embraced the ability to customize their own analysis for Say on Pay in accordance with their own methodologies using CGLytics’ data.

    Leveled the playing field for corporate issuers
    With access to the same tools and underlying data as Glass Lewis, corporate issuers can now proactively understand how they are viewed in relation to their peers.


    USE THE SAME DATA AND TOOLS AS GLASS LEWIS

    Customers can now instantly view the Glass Lewis executive compensation analysis and peer group modeling for planning their Say on Pay agenda via CGLytics. CGLytics and Glass Lewis have established a global partnership to provide unmatched compensation data and analytics for corporates, investors and advisors.

     • Ensure effective engagement, risk oversight and modern governance practices with CGLytics.

     • Instantly view the Glass Lewis CEO and executive remuneration analysis in the CGLytics platform.

     • Use the same data set and analytical tools trusted by Glass Lewis’ global research team and featured in the reports used by its institutional investor clients.

     • Self-construct peer groups from an extensive global data set of 5,000+ public companies for benchmarking executive pay

    Click here to learn more about CGLytics’ boardroom intelligence capabilities and executive remuneration analytics, used by institutional investors, activist investors and advisors.

    Latest Industry News, Views & Information

    Understanding ESG & Annual Incentive Plan

    Understanding ESG & Annual Incentive Plan ESG refers to a series of environmental, social and governance criteria taken into consideration by the funds during the investing process. Investing in ESG funds allows shareholders to support companies in transition, that wish to act and develop in a more sustainable and responsible manner. In practice, many indicators … Continue reading “Understanding ESG & Annual Incentive Plan”

    Pay for Performance: The Largest Institutional Investors’ View

    Pay for Performance: The Largest Institutional Investors’ View   Executive compensation has been one of the trickiest issues within the corporate governance space as of late. Across the board, there seems to be no end in sight to finding the perfect compensation package or philosophy for corporate executives. In this article, we will discuss the … Continue reading “Pay for Performance: The Largest Institutional Investors’ View”

    How to design your peer group for compensation benchmarking

    How to design your peer group for compensation benchmarking   Given the scrutiny on executive compensation in recent years, it is critical to make sure that your company’s executive pay reflects its performance and aligns with the market. Therefore, it is essential for companies to have an appropriate peer group for performance benchmarking, compensation program … Continue reading "How to design your peer group for compensation benchmarking"

    Are companies incorporating ESG factors into executive remuneration?

    The last decade has seen a steady increase in the focus on Environmental, Social and Governance (ESG) factors from a range of stakeholders and that growing scrutiny appears to have reached a crescendo over the past 18 months. Only the topic of executive remuneration continues to be discussed as frequently as ESG.

    FTI & CGLytics have conducted an analysis to determine whether those two topics are increasingly converging. Download the white paper to find out more.

    A white paper from FTI Consulting and CGLytics

    Are companies incorporating ESG factors into executive remuneration?

    The last decade has seen a steady increase in the focus on Environmental, Social and Governance (ESG) factors from a range of stakeholders and that growing scrutiny appears to have reached a crescendo over the past 18 months. Only the topic of executive remuneration continues to be discussed as frequently as ESG.

    FTI & CGLytics have conducted an analysis to determine whether those two topics are increasingly converging. While there is evidence that the number of companies including some form of ESG-related measures in incentive plans has grown, the proportion of overall pay determined directly by performance against ESG criteria remains at the margin.

    Download the report to find out more.

    DOWNLOAD THE REPORT

    Latest Industry News, Views & Information

    • All
    • Blog

    Understanding ESG & Annual Incentive Plan

    Understanding ESG & Annual Incentive Plan ESG refers to a series of environmental, social and governance criteria taken into consideration by the funds during the investing process. Investing in ESG funds allows shareholders to support companies in transition, that wish to act and develop in a more sustainable and responsible manner. In practice, many indicators … Continue reading “Understanding ESG & Annual Incentive Plan”

    Pay for Performance: The Largest Institutional Investors’ View

    Pay for Performance: The Largest Institutional Investors’ View   Executive compensation has been one of the trickiest issues within the corporate governance space as of late. Across the board, there seems to be no end in sight to finding the perfect compensation package or philosophy for corporate executives. In this article, we will discuss the … Continue reading “Pay for Performance: The Largest Institutional Investors’ View”

    How to design your peer group for compensation benchmarking

    How to design your peer group for compensation benchmarking   Given the scrutiny on executive compensation in recent years, it is critical to make sure that your company’s executive pay reflects its performance and aligns with the market. Therefore, it is essential for companies to have an appropriate peer group for performance benchmarking, compensation program … Continue reading "How to design your peer group for compensation benchmarking"

    The increasing trend of shareholder opposition to executive pay

    Votes against executive remuneration are growing. In this article we look at this change in the European indices and the S&P500.

    During 2019 we saw an increase in the volume of shareholders making their feelings known about what they perceived as misaligned executive pay policies. This was brought on by lacklustre performance by their portfolios.

    With a string of high-profile stories, executive compensation was rarely out of the news, and an increasing number of organisations became the focus of media outcry, damaging brands and forcing companies onto the defensive.

    As the press and investor relations teams scrambled to justify the remuneration of their CEOs and other executives, CGLytics has taken a look into its historical data set to see whether this is part of an increasing trend of shareholder activism.

    From the CGLytics coverage, which includes more than 5,500 companies across the globe, we have analysed the proxy votes submitted so far in 2019. During this time more than 3 trillion votes were cast against remuneration policies submitted. We have compared this number to the three years prior.

    An accelerating trend

    Looking back, we can see that shareholder opposition to director remuneration policies across Europe has increased. And increased significantly.

    From 2016 to 2017 there was only a proportional 9% increase from 2.1% to 2.3% opposition, however in 2018 we see an indication that shareholders were getting frustrated.

    Percent of votes against remuneration policies - Europe

    From 2017 to 2018 there was a 40% increase in opposition to remuneration policies. While this is still a relatively overall small percentage of 3.2% opposition of the total votes, for some issuers this was a red flag and ensured that they proactively engaged with their shareholders to ensure clarity on awards and demonstrate that they were taking shareholder views into account.

    However, many organisations failed to heed the warnings and 2019 saw the proportion of votes against director remuneration policies increase by 90%, up to 6.1% of total votes cast.

    Meanwhile in the S&P500

    Many US based companies have been under pressure from shareholders to curb perceived excessive pay, and this can be seen by the annual comparison below where in 2019, shareholders cast 16.3% of their votes against the recommended remuneration policies.

    Percent of shareholder votes against remuneration policies - SP500

    This consistently high level of shareholder opposition to executive remuneration reflects the idea that executives are receiving outweighted rewards compared to the overall growth and performance metrics that they are delivering.

    What does 2020 have in store?

    As you may have seen in our “Top 50 Highest Paid CEOs” article earlier in the summer, executive pay has the potential to increase significantly compared to relatively flat performance indicators (such as TSR), so it’s not unexpected that the shareholder opposition will continue to accelerate into the 2020 proxy season.

    Proactive engagement is the key

    CGLytics is the global compensation partner for Glass Lewis, the leading independent proxy advisor, who work with over 1,300 institutional investors around the globe. In our recent “behind the scenes with Glass Lewis” webinar, Andrew Gebelin, VP of Research, Engagement and Stewardship highlighted the benefits of organisations proactively engaging with both proxy advisors and investors to reduce the risk of mis-interpretation of remuneration policy elements and maximise the information available prior to AGM votes.

    Access Glass Lewis’ Say on Pay analysis – Available through CGLytics

    Glass Lewis uses CGLytics as it’s global compensation data provider. For the 2020 proxy season our data will provide the basis of Glass Lewis’ Say on Pay recommendations.


    Learn More

    Latest Industry News, Views & Information

    Understanding ESG & Annual Incentive Plan

    Understanding ESG & Annual Incentive Plan ESG refers to a series of environmental, social and governance criteria taken into consideration by the funds during the investing process. Investing in ESG funds allows shareholders to support companies in transition, that wish to act and develop in a more sustainable and responsible manner. In practice, many indicators … Continue reading “Understanding ESG & Annual Incentive Plan”

    Pay for Performance: The Largest Institutional Investors’ View

    Pay for Performance: The Largest Institutional Investors’ View   Executive compensation has been one of the trickiest issues within the corporate governance space as of late. Across the board, there seems to be no end in sight to finding the perfect compensation package or philosophy for corporate executives. In this article, we will discuss the … Continue reading “Pay for Performance: The Largest Institutional Investors’ View”

    How to design your peer group for compensation benchmarking

    How to design your peer group for compensation benchmarking   Given the scrutiny on executive compensation in recent years, it is critical to make sure that your company’s executive pay reflects its performance and aligns with the market. Therefore, it is essential for companies to have an appropriate peer group for performance benchmarking, compensation program … Continue reading "How to design your peer group for compensation benchmarking"

    Equity Compensation Model: Press Release

    CGLytics and Glass Lewis set a new standard for transparency in equity-based compensation

    Logo white
    GL_reversed_logo_horizontal

    Newly released technology tests 11 key criteria that leading proxy advisor uses to assess plans

    [Amsterdam, London, San Francisco – September 19, 2019] – CGLytics, a leading global provider of governance data and analytics, and Glass Lewis, the world’s leading independent provider of governance and engagement support services, today announced the launch of Glass Lewis’ Equity Compensation Model (ECM) – a powerful new application for assessing U.S. equity-based compensation plans, available exclusively via CGLytics.

    This new application provides invaluable intelligence with year-round, on-demand access to Glass Lewis’ methodology which is used to evaluate the overall favorability of current and future equity plans, including tests against 11 key criteria. Companies and investors can now instantly test, review and adjust the same individual inputs as Glass Lewis’ analysts to ensure the best compensation, engagement and voting outcomes for their respective sides.

    The ECM provides companies with immediate and proactive insight into the concerns regarding current and future equity plans, which Glass Lewis highlights to more than 1,300 investors representing more than $35 trillion in assets under management. In addition, with coverage of more than 4,300 publicly traded U.S. companies, investors can assess investment risks across their portfolio with regard to current equity plans or those being proposed.

    Aaron Bertinetti, SVP of Research & Engagement at Glass Lewis explains: “Our analysts research and openly engage with thousands of companies and their investors every year, building invaluable insight and governance expertise as a result. We strongly believe that good governance is good for everybody, which means we must empower the capital markets by democratizing access to our deep governance expertise in a transparent, intuitive and unconflicted manner. The ECM gives companies and investors the same governance tools we use internally and have developed over many years. It will bring greater transparency, improved governance and market confidence by fostering alignment of corporate and investor interests in compensation plans.”

    The ECM is available as a stand-alone service and is only available via CGLytics and its market-leading software. Corporate issuers can test and refine their equity plans, understand the level of concern from shareholders and ultimately be successful in seeking the shareholder support required to legally grant equity compensation. On the other hand, investors can test the equity plans for companies in their portfolio, perform comprehensive benchmarking of plan costs and evaluate the risk of any potential dilution to enhance their engagement and voting decisions.

    Getting equity compensation right is a pivotal part of modernizing corporate governance. Issuers and institutional investors must be satisfied that proposed plans meet the long-term needs for the business and its shareholders. ECM will completely change the way both sides approach these challenges, setting a new benchmark for transparency in the decision-making process and driving good governance practices.” said Aniel Mahabier, CEO of CGLytics.

    The offering, initially launched for the U.S. market, covers 4,300+ publicly traded U.S. firms including the Russell 3000, S&P 1500, S&P MidCap 400 and SmallCap 600.

    About CGLytics

    CGLytics is transforming the way corporate governance decisions are made. Combining the broadest corporate governance dataset, with the most comprehensive analytics tools, CGLytics empowers corporations, investors and professional services to instantly perform a governance health check and make better informed decisions. From unique Pay for Performance analytics and peer comparison tools, to board effectiveness insights, companies and investors have access to the most comprehensive source of governance information at their fingertips – powering the insights required for good modern governance.

    About Glass Lewis

    Glass Lewis, the leading independent provider of global governance and engagement support services, helps institutional investors understand and connect with companies they invest in. Glass Lewis is a trusted ally of more than 1,300 investors globally who use its high-quality, unbiased Proxy Paper research and industry-leading Viewpoint proxy vote management solution to drive value across all their governance activities.

    Latest Industry News, Views & Information

    Understanding ESG & Annual Incentive Plan

    Understanding ESG & Annual Incentive Plan ESG refers to a series of environmental, social and governance criteria taken into consideration by the funds during the investing process. Investing in ESG funds allows shareholders to support companies in transition, that wish to act and develop in a more sustainable and responsible manner. In practice, many indicators … Continue reading “Understanding ESG & Annual Incentive Plan”

    Pay for Performance: The Largest Institutional Investors’ View

    Pay for Performance: The Largest Institutional Investors’ View   Executive compensation has been one of the trickiest issues within the corporate governance space as of late. Across the board, there seems to be no end in sight to finding the perfect compensation package or philosophy for corporate executives. In this article, we will discuss the … Continue reading “Pay for Performance: The Largest Institutional Investors’ View”

    How to design your peer group for compensation benchmarking

    How to design your peer group for compensation benchmarking   Given the scrutiny on executive compensation in recent years, it is critical to make sure that your company’s executive pay reflects its performance and aligns with the market. Therefore, it is essential for companies to have an appropriate peer group for performance benchmarking, compensation program … Continue reading "How to design your peer group for compensation benchmarking"

    The increasing popularity of linking equity compensation to socially responsible practices

    Social responsibility is an increasing priority for corporates, reflecting changing pressures from stakeholders and society. In this article CGLytics looks at the trend of linking executive equity compensation to responsible social practices.

    Historically, the primary concern of shareholders and company executives has been to deliver returns on investments and ensure that the company meets or exceeds their quarterly earnings expectations. Inevitably this led to a more short-term view with any projects that didn’t contribute to the present quarter / yearly results being at risk of cuts.

    However, as some of the leading shareholders continue to embrace their roles in ensuring that companies are held accountable for their impact on both the environment and society, a growing trend has emerged of remuneration committees coming under pressure to link equity and compensation awards to sustainable environmental and socially responsible business practices (E.g. Alphabet 2019 Proxy Statement – Proposal 13).

    A number of studies [Project ROI] have been carried out that link social and environmental impact to attracting and retaining customers, increasing revenue and building a vibrant corporate culture, whilst also having significant brand impact in a landscape where simply achieving results may become secondary to the “how” they were achieved.

    Linking social impact to executive compensation

    One of the most significant hurdles of linking the social impact of a company to the equity based compensation of senior executives and directors has been the attempt to identify  quantifiable measures for what can be a very subjective definition of success.

    As the topic has come under more scrutiny there has been a visible appetite for businesses to provide more reporting and demonstrate measures that have been taken to ensure they partake in socially responsible practices. This can include:

    • Auditing suppliers to ensure that they and their subcontractors adhere to the values that they wish to demonstrate,
    • Allocating employee time and resources to positively impact society, or
    • Specific metrics regarding health and safety at work.

    An example of this trend is Alcoa. In their 2019 proxy statement Alcoa links 30% of incentive goals to non-financial measures such as safety at work and diversity in the workforce, up from 20% in 2018.

    In addition to the individual metrics defined by organizations, there has also been a growing trend of executive compensation being linked to the performance of a company on a corporate responsibility index (e.g. Dow Jones Sustainability Index). By linking elements of incentive multipliers to performance against a wider set of peers and the index, companies are able to not only create quantifiable targets to base awards on but are also focused on ensuring that they take a long term view in order to outperform competitors.

    Gathering momentum

    By defining these criteria and linking to long term incentives, businesses are more able to demonstrate their roles in a socially responsible business world. The positive financial impact of a socially responsible business is only a relatively recent trend. However, with a growing number of large investors taking an active role in the stewardship and engagement of their assets (Blackrock letter to CEOs), it is a trend that is likely to continue to gain traction.

    Conversely, organizations that are perceived to be failing to meet their obligations to society will increasingly impact the brand, reputation, and ultimately the bottom line. Hence companies that traditionally have been focused on their financial results are exploring how they can adapt to the new criteria.

    The Glass Lewis Equity Compensation Model

    Glass Lewis’ Equity Compensation Model (ECM) is now available exclusively via CGLytics. Providing unprecedented transparency to the U.S. market in one powerful online application, both companies and investors can use the same 11 key criteria as the leading proxy advisor to assess equity incentive plans.

    Click here to experience Glass Lewis’ new application.

    Latest Industry News, Views & Information

    Understanding ESG & Annual Incentive Plan

    Understanding ESG & Annual Incentive Plan ESG refers to a series of environmental, social and governance criteria taken into consideration by the funds during the investing process. Investing in ESG funds allows shareholders to support companies in transition, that wish to act and develop in a more sustainable and responsible manner. In practice, many indicators … Continue reading “Understanding ESG & Annual Incentive Plan”

    Pay for Performance: The Largest Institutional Investors’ View

    Pay for Performance: The Largest Institutional Investors’ View   Executive compensation has been one of the trickiest issues within the corporate governance space as of late. Across the board, there seems to be no end in sight to finding the perfect compensation package or philosophy for corporate executives. In this article, we will discuss the … Continue reading “Pay for Performance: The Largest Institutional Investors’ View”

    How to design your peer group for compensation benchmarking

    How to design your peer group for compensation benchmarking   Given the scrutiny on executive compensation in recent years, it is critical to make sure that your company’s executive pay reflects its performance and aligns with the market. Therefore, it is essential for companies to have an appropriate peer group for performance benchmarking, compensation program … Continue reading "How to design your peer group for compensation benchmarking"

    2019 CEO Pay Review: The Top 50 Highest Paid CEOs

    As proxy season progresses and companies file their annual reports, CGLytics surveys the world’s highest paid CEOs (so far) and looks at how executive compensation has grown since the last year.

    CEO Pay continued to dominate the AGM season in 2019. As we take a break over the summer, it’s worth reviewing the top 50 highest paid CEOs and seeing how this has changed from 2018.

    We also take a look at how the performance of these companies has increased to understand how executives are rewarded for performance.

    Key CEO pay take aways from the first half of 2019 :

    • The top 50 total granted compensation has increased by over 300% from 2018 to 2019 ($4.49bn compared to $1.12bn).
    • Although over 50% of the $4.4bn is attributable to one individual’s granted compensation (Elon Musk, Tesla: $2.28bn).
    • Even discounting this outlier, total granted executive compensation increased by 97%.
    • Meanwhile the average growth in market capitalisation was around 3% from 2018.
    • And 1 year Total Shareholder Return (TSR) actually shrank by 1%.


    Given these significant increases in total granted compensation compared to the value being delivered to shareholders, it’s easy to see why CEO pay and compensation continues to dominate AGM discussions.

    Trending Top 50 CEOs

    Ranking

    CEO

    Company

    Total Granted
    Compensation

    Total Realised Pay

    TSR in %

    TSR 1YR growth in
    %point

    1

    Musk, Elon

    Tesla, Inc.

    $2,284,044,884
    (
    54575310%)

    $56,380 (513%)

    57%

    515%

    2

    Smith, Patrick

    Axon Enterprise, Inc.

    $246,026,710
    (
    56433%)

    $25,488,720
    (
    5472%)

    565%

    592%

    3

    Zaslav, David

    Discovery Communications, Inc.

    $129,499,005
    (
    5207%)

    $33,498,259
    (
    662%)

    511%

    543%

    4

    Glancey, Stephen

    C&C Group plc

    $119,819,023
    (
    510%)

    $1,643,004
    (
    536%)

    50%

    62%

    5

    Hodler, Bernhard

    Julius Baer Group Ltd.

    $78,813,367
    (
    54694%)

    $2,979,804
    (
    581%)

    640%

    639%

    6

    Levine, Jay

    OneMain Holdings, Inc.

    $71,532,583
    (
    516913%)

    $71,532,583
    (
    516913%)

    67%

    62%

    7

    Schwarzman, Stephen

    The Blackstone Group L.P.

    $69,147,028
    (
    645%)

    $69,147,028
    (
    645%)

    50%

    51%

    8

    Legere, John

    T-Mobile US, Inc.

    $66,538,206
    (
    5270%)

    $42,071,611
    (
    5243%)

    50%

    57%

    9

    Iger, Robert

    The Walt Disney Company

    $65,645,214
    (
    581%)

    $66,065,073
    (
    68%)

    54%

    56%

    10

    Steele, Gary

    Proofpoint, Inc.

    $64,730,296
    (
    5892%)

    $54,931,367
    (
    528%)

    66%

    510%

    11

    Charlès, Bernard

    Dassault Systèmes SE

    $51,098,970
    (
    577%)

    $65,983,199
    (
    578%)

    518%

    517%

    12

    Alber, Laura

    Williams-Sonoma, Inc.

    $50,758,332
    (
    5252%)

    $28,830,401
    (
    5224%)

    51%

    63%

    13

    Heppelmann, James

    PTC Inc.

    $49,969,163
    (
    5403%)

    $17,041,464
    (
    5107%)

    536%

    546%

    14

    Freda, Fabrizio

    The Estée Lauder Companies Inc.

    $48,753,819
    (
    50%)

    $9,387,109
    (
    683%)

    53%

    56%

    15

    Buckley, Henry

    Uni-Select Inc.

    $47,774,090
    (
    52687%)

    $47,012,426
    (
    53416%)

    630%

    634%

    16

    Handler, Richard

    Jefferies Financial Group Inc.

    $44,674,213
    (
    5105%)

    $5,951,709
    (
    5339%)

    633%

    638%

    17

    Kilroy, John

    Kilroy Realty Corporation

    $43,624,774
    (
    5282%)

    $18,204,958
    (
    622%)

    614%

    610%

    18

    Bird, Lewis

    At Home Group Inc.

    $43,089,790
    (
    52477%)

    $1,614,791
    (
    63%)

    639%

    632%

    19

    Lebda, Douglas

    LendingTree, Inc.

    $42,318,238
    (
    629%)

    $164,584,011
    (
    53682%)

    636%

    628%

    20

    MacMillan, Stephen

    Hologic, Inc.

    $42,040,142
    (
    5275%)

    $12,231,622
    (
    656%)

    64%

    56%

    21

    Hogan, Joseph

    Align Technology, Inc.

    $41,758,338
    (
    5256%)

    $69,763,660
    (
    5504%)

    66%

    61%

    22

    Schulman, Daniel

    PayPal Holdings, Inc.

    $37,764,588
    (
    596%)

    $41,295,115
    (
    5328%)

    514%

    517%

    23

    Hastings, Reed

    Netflix, Inc.

    $36,080,417
    (
    548%)

    $4,064,854
    (
    698%)

    539%

    547%

    24

    Roberts, Brian

    Comcast Corporation

    $35,026,207
    (
    58%)

    $47,400,117
    (
    640%)

    613%

    613%

    25

    Jellison, Brian

    Roper Technologies, Inc.

    $34,931,318
    (
    520%)

    $142,847,568
    (
    5103%)

    54%

    59%

    26

    Wenig, Devin

    eBay Inc.

    $34,842,832
    (
    597%)

    $19,946,164
    (
    566%)

    626%

    628%

    27

    Thiry, Kent

    DaVita Inc.

    $32,017,501
    (
    5109%)

    $13,983,054
    (
    610%)

    629%

    632%

    28

    Kotick, Robert

    Activision Blizzard, Inc.

    $30,841,004
    (
    57%)

    $4,307,586
    (
    697%)

    626%

    622%

    29

    Wichmann, David

    UnitedHealth Group Incorporated

    $30,824,112
    (
    577%)

    $22,558,157
    (
    673%)

    515%

    518%

    30

    Dimon, James

    JPMorgan Chase & Co.

    $30,033,745
    (
    56%)

    $18,136,934
    (
    687%)

    67%

    68%

    31

    Lutnick, Howard

    BGC Partners, Inc.

    $29,694,152
    (
    589%)

    $17,791,850
    (
    511%)

    643%

    659%

    32

    Stephenson, Randall

    AT&T Inc.

    $29,118,118
    (
    51%)

    $21,606,548
    (
    614%)

    622%

    69%

    33

    Narayen, Shantanu

    Adobe Systems Incorporated

    $28,397,528
    (
    529%)

    $67,297,455
    (
    555%)

    529%

    534%


    Benioff, Marc

    salesforce.com, inc.

    $28,391,846
    (
    5510%)

    $44,183,075
    (
    662%)

    534%

    549%

    35

    Moghadam, Hamid

    Prologis, Inc.

    $28,201,397
    (
    546%)

    $35,887,540
    (
    56%)

    66%

    516%

    36

    Gorman, James

    Morgan Stanley

    $28,168,639
    (
    515%)

    $19,299,856
    (
    652%)

    623%

    624%

    37

    Florance, Andrew

    CoStar Group, Inc.

    $27,555,954
    (
    5159%)

    $18,644,383
    (
    517%)

    514%

    520%

    38

    Greenberg, Robert

    Skechers U.S.A., Inc.

    $27,361,406
    (
    5252%)

    $11,157,656
    (
    515%)

    640%

    637%

    39

    Umpleby, D.

    Caterpillar Inc.

    $27,289,513
    (
    594%)

    $14,840,544
    (
    5171%)

    618%

    616%

    40

    Fink, Laurence

    BlackRock, Inc.

    $26,543,344
    (
    64%)

    $51,471,260
    (
    561%)

    622%

    621%

    41

    Schleifer, Leonard

    Regeneron Pharmaceuticals, Inc.

    $26,520,555
    (
    50%)

    $117,840,017
    (
    524%)

    61%

    56%

    42

    Chenault, Kenneth

    American Express Company

    $24,208,661
    (
    530%)

    $54,431,474
    (
    642%)

    63%

    61%

    43

    Holmes, Stephen

    Wyndham Worldwide Corporation

    $21,479,166
    (
    542%)

    $50,161,004
    (
    553%)

    629%

    669%

    44

    Johnson, R.

    HCA Healthcare, Inc.

    $21,419,906
    (
    524%)

    $109,050,692
    (
    51407%)

    543%

    544%

    45

    Banga, Ajaypal

    MasterCard Incorporated

    $20,379,353
    (
    59%)

    $60,704,447
    (
    5145%)

    525%

    528%

    46

    Brown, Gregory

    Motorola Solutions, Inc.

    $20,348,558
    (
    533%)

    $69,555,180
    (
    5137%)

    530%

    535%

    47

    Minogue, Michael

    ABIOMED, Inc.

    $19,243,230
    (
    587%)

    $123,043,867
    (
    5907%)

    573%

    585%

    48

    Casper, Marc

    Thermo Fisher Scientific Inc.

    $18,607,103
    (
    616%)

    $85,476,755
    (
    5161%)

    518%

    524%

    49

    Meyer, James

    Sirius XM Holdings Inc.

    $17,633,953
    (
    582%)

    $50,452,233
    (
    5331%)

    57%

    56%

    50

    Fairbank, Richard

    Capital One Financial Corporation

    $17,333,796
    (
    57%)

    $108,527,637
    (
    557%)

    623%

    622%

    [1] Compensation in USD – exchange rates based on single point of time, end of tax year 2018.

    [2] Excludes executives appointed since 2017 season.

    Want to know the impact COVID-19 has had on executive compensation?

    Download our latest whitepaper to learn how you can address a range of governance, design and administration challenges that involve executive and non-employee director compensation programs.

    Latest Industry News, Views & Information

    How the SEC’s new proxy voting rules will impact executive compensation

    There are many software applications and tools now available to support compensation decisions, but what should be taken into consideration before purchasing? This 5-minute guide details what Compensation Committees, Heads of Reward and Compensation Professionals should take into account when selecting software and tools for Say-on-Pay decisions.

    S&P 500 Banking Industry’s Response to COVID-19

    CGLytics examines how S&P 500 banks responded to the volatility of the pandemic prior to the Fed’s announcement to cap bank dividends and prohibit share repurchases until Q4 following its annual stress test of banks.

    How to independently and efficiently benchmark executive compensation for Say-on-Pay

    There are many software applications and tools now available to support compensation decisions, but what should be taken into consideration before purchasing? This 5-minute guide details what Compensation Committees, Heads of Reward and Compensation Professionals should take into account when selecting software and tools for Say-on-Pay decisions.

    Data puts CEO rewards into perspective in the Netherlands

    In this article, originally published in Dutch in Mgmt. Scope, CGLytics examines CEO pay in the Netherlands and how it is one of the hottest topics in shareholder discussions.

    This article on CEO pay in the Netherlands first appeared in Dutch in Mgmt. Scope on 27th May 2019: https://managementscope.nl/online/data-zet-beloning-ceo-in-perspectief

    Shareholders are making themselves heard more than ever about the strategy of the company. Certainly the remuneration of directors has gained much attention. Corporate governance analytics – the specialization of CGLytics – helps to separate the facts from the opinions in regards to remuneration policies. This is also not a superfluous luxury: data shows that shareholders are quite rightly concerned.

    In recent years, shareholders have been expressing themselves more and more emphatically at General Meetings of Shareholders (AGMs). In 2018, the average number of votes cast at the AGMs of AEX companies reached a record level of 72.4 percent. Never before have shareholders voted so massively on the issues that concern them. The most important topic from a distance: the remuneration of directors. The figures for 2019 are not yet complete, but the same picture emerges.

    Remuneration of directors

    What does the data say? The remuneration policy, and certainly the alignment of the CEO’s remuneration, keeps the minds of shareholders busy. The average percentage of votes against the remuneration policy of all Dutch listed companies rose to 16.5 percent in 2018. That is more than double the average for the combined years of 2015, 2016 and 2017. The media is also paying more and more attention to the remuneration policy of companies. These are important reasons to take any adjustments to the remuneration policy very seriously. Paying attention to remuneration fits in with the development of corporate social responsibility (ESG practices). Companies must be able to indicate how the remuneration of the CEO contributes to long-term value creation. They must also be willing to discuss their performance in this area. For example, in the amended corporate governance code, the disclosure of the relationship between the remuneration of CEOs and the average employee is already mandatory. The legislation is expected to follow soon.

    Pay for performance

    An important indicator for value creation in the long term is pay for performance, or the ratio between remuneration and performance. There is still a lot for companies to do in this area. Data from CGLytics shows that the financial performance of companies and the rewards of their CEOs are poorly aligned. 44 percent of the 25 AEX companies – measured over the 2017 financial year – have an imbalance between remuneration and performance. Which means the CEO’s remuneration is higher than expected based on the company’s performance. Over a three-year period, 2015-2017, this is 38 percent. There is also good news. Over the past five years, AEX companies have found a better mix between fixed, short-term and long-term bonuses in their remuneration policy for directors. The average basic salary and the long-term bonuses increased, while the size of the short-term bonuses decreased. It is generally accepted that a fixed compensation and long-term bonuses do more for long-term value creation for stakeholders.

    Data provides insight

    Data therefore offers important insights; not just for shareholders. It is not for nothing that an increasing number of directors, supervisors, remuneration committees and investors use corporate governance data to test the remuneration policy. Data helps determine an adequate remuneration structure and makes it possible to distinguish the facts from the opinions.

    Latest Industry News, Views & Information

    Understanding ESG & Annual Incentive Plan

    Understanding ESG & Annual Incentive Plan ESG refers to a series of environmental, social and governance criteria taken into consideration by the funds during the investing process. Investing in ESG funds allows shareholders to support companies in transition, that wish to act and develop in a more sustainable and responsible manner. In practice, many indicators … Continue reading “Understanding ESG & Annual Incentive Plan”

    Pay for Performance: The Largest Institutional Investors’ View

    Pay for Performance: The Largest Institutional Investors’ View   Executive compensation has been one of the trickiest issues within the corporate governance space as of late. Across the board, there seems to be no end in sight to finding the perfect compensation package or philosophy for corporate executives. In this article, we will discuss the … Continue reading “Pay for Performance: The Largest Institutional Investors’ View”

    How to design your peer group for compensation benchmarking

    How to design your peer group for compensation benchmarking   Given the scrutiny on executive compensation in recent years, it is critical to make sure that your company’s executive pay reflects its performance and aligns with the market. Therefore, it is essential for companies to have an appropriate peer group for performance benchmarking, compensation program … Continue reading "How to design your peer group for compensation benchmarking"

    In the spotlight: EQT Corporation Proxy Statement

    In this article, CGLytics takes a look at the upcoming EQT Corporation AGM resolutions and how the CGLytics platform analytics can help promote engagement between the company and shareholders.

    EQT Corporation AGM

    As proxy season in the United States is winding down, only a handful of companies are still left to host their Annual General Meeting (AGM).  EQT Corporation, the largest natural-gas producer in the US, will host its AGM on July 10 and has subsequently invited its shareholders to attend and vote on four resolutions. Namely:

    1. The election to the Company’s Board of Directors of the 12 directors nominated by the Board to serve for one-year terms
    2. The approval of a non-binding resolution regarding the compensation of the Company’s named executive officers for 2018
    3. The approval of the EQT Corporation 2019 Long-Term Incentive Plan
    4. The ratification of Ernst & Young LLP as the Company’s independent registered public accounting firm for 2019

    Contested Election

    With twelve incumbent management nominees, “Rice Group” has also put forward six nominees for election utilizing the universal proxy card, which the board adopted in 2019. Toby Rice, partner of Rice Investment Group, elaborated on individual nominations by saying “We believe a comprehensive solution is required to effect the fundamental course correction needed to deliver full value to shareholders”. In response the leadership team at EQT has urged voters to disregard the plea from the Rice Group by arguing that the nominations would “immediately jeopardize the value of [the] investment by installing their friends”.

    CGLytics’ Board expertise analytics shows that, given the current board’s composition, the board currently lacks expertise in the following sectors: Technology, Financial, Governance, International, and Industry/Sector.

    Source: CGLytics Data and Analytics

    EQT Corporation proposes the election of the following three individuals: Janet L. Carrig, James T. McManus and Valera A. Mitchell.  If elected, the areas of expertise the three nominees would bring to EQT’s Board would be Governance, Executive, Non-Executive, Leadership and International. This also means that post-election of these director nominees, the board would remain unbalanced in regard to Technology and Financial Expertise. However, when reviewing the background of just three of the six nominees from the Rice Group, Lydia I. Beebe, Lee M. Canaan and Kathryn J. Jackson, their aggregate expertise is comprised of Non-Executive, Executive, Leadership, and most notably, Governance, Financial expertise and Technology.

    CGLytics does not advocate for or against the election of any of the individuals, however governance matters should entail a certain level of scrutiny. The data analytics available on the CGLytics platform provides for a new and unparalleled insight into governance issues which helps place agency back in the hands of the shareholder and helps companies to better understand their practice against market norms.

    Executive Compensation

    Earlier in 2018, EQT underwent several key management changes including the appointment of a new CEO and CFO. In March 2018 Steven Schlotterbeck stepped down as CEO for personal reasons and was succeeded by interim CEO David Porges. In November in the same year Robert McNally, previously CFO, was appointed as CEO and Jimmi Sue Smith took over as CFO. Several board members were also appointed to replace departing directors.

    Item 2 on the agenda dictates a vote on the approval of the compensation of the company’s named executive officers. When reviewing the CEO’s compensation proposal with CGLytics’ executive compensation and pay for performance modeler, we find a potential misalignment between CEO remuneration and one-year total shareholder return.

    CGLytics’ data and analytics are trusted and used worldwide by Glass Lewis, the leading independent proxy advisor, as a basis for their research on companies.

    Like most U.S. corporations, EQT Corporations proxy statement describes their compensation packages as “weighted in favor of performance-based, at-risk compensation through annual and long-term performance-based incentive programs”. Delving further into the pay-structure of the CEO, this philosophy seems to hold true as most of the remuneration is derived from Long term and short-term incentives (LTIs and STIs). Stock awards account for the majority of the LTIs for the CEO where the largest contributor in dollar amount is the Incentive PSU program, with TSR being the highest weighted performance criterion. In particular, considering EQT’s emphasis on TSR, it is important to note the long-term diverging trend between the company’s one-year TSR and CEO remuneration. More specifically, executive pay from 2016 and onwards has been on the rise while TSR has been declining and currently sits at its lowest point over the last 10 years.

    Source: CGLytics P4P Modeler

    Moreover, when comparing EQT’s CEO pay practise relative to its disclosed peer group, as disclosed in the graphs below, we see a pay for performance misalignment between TSR and compensation over both a one -year and five-year period.

    Source: CGLytics P4P Modeler

    Item 3 on the agenda entails the approval of the 2019 Long-Term Incentive Plan which enables the company to grant stock awards to its executive officers. The granting of these awards will be based on the achievement of certain performance measures, namely relative TSR (50% weight), operating efficiency (25% weight), and development efficiency (25% weight). Moreover, the ultimate payout under the award plan is subject to a modifier based on achieved ROCE, which could push executives’ payout as high as 1.1 times higher than based on achievement of the three preceding performance criteria alone.

    CGLytics offers the broadest, up to date global data set and powerful benchmarking tools to conduct comprehensive analysis for executive compensation decisions and risk oversight. CGLytics is Glass Lewis’ source for global compensation data and analytics. These analytics power Glass Lewis’ voting recommendations in both their proxy papers and their custom policy engine service.

    For more information regarding how CGLytics’ deep, global data set and unparalleled analytical screening tools can potentially help you make better decisions, click here.

    Sources:

    CGLYTICS DATA AND ANALYTICS   EQT 2019 PROXY STATEMENT

    About the Author

    Jaco Fourie: U.S. Research Analyst

    Jaco holds a Bachelor of Science degree in Accounting and Finance from the University of Reading. He has gained experience as a research analyst from his enrollment at the Henley Business School and the International Capital Market Association Centre.

    Latest Industry News, Views & Information

    Understanding ESG & Annual Incentive Plan

    Understanding ESG & Annual Incentive Plan ESG refers to a series of environmental, social and governance criteria taken into consideration by the funds during the investing process. Investing in ESG funds allows shareholders to support companies in transition, that wish to act and develop in a more sustainable and responsible manner. In practice, many indicators … Continue reading “Understanding ESG & Annual Incentive Plan”

    Pay for Performance: The Largest Institutional Investors’ View

    Pay for Performance: The Largest Institutional Investors’ View   Executive compensation has been one of the trickiest issues within the corporate governance space as of late. Across the board, there seems to be no end in sight to finding the perfect compensation package or philosophy for corporate executives. In this article, we will discuss the … Continue reading “Pay for Performance: The Largest Institutional Investors’ View”

    How to design your peer group for compensation benchmarking

    How to design your peer group for compensation benchmarking   Given the scrutiny on executive compensation in recent years, it is critical to make sure that your company’s executive pay reflects its performance and aligns with the market. Therefore, it is essential for companies to have an appropriate peer group for performance benchmarking, compensation program … Continue reading "How to design your peer group for compensation benchmarking"

    Manzama and CGLytics announce partnership to change the way law firms develop new business relationships and forward-thinking governance practices

    Powerful relationship analytics coupled with governance information are taking law firms to the next level

    manzama-logo-header-retina-white-51

    Powerful relationship analytics coupled with governance information are taking law firms to the next level

    The Manzama and CGLytics partnership is changing the way law firms develop new business relationships and forward-thinking governance practices

    Keeping pace with changing market dynamics, clients, their key decisionmakers, corporate networks and competitors, is vital for law firms to continually add value, differentiate and unlock new business development opportunities.

    Manzama and CGLytics have joined forces to drive business development and opportunities for world leading law firms. Through this partnership, law firms gain access to intuitive relationship mapping tools, revealing connections between corporate decisionmakers, their peers, as well as finding the easiest and shortest way to connect, which is not an easy feat. Clients can keep track of key executive movements and corporate changes by receiving daily or weekly updates and alerts.

    CGLytics’ extensive database provides access to hundreds of thousands of comprehensive profiles of business leaders including their compensation arrangements and corporate networks of more than 5,500 globally listed companies. Its powerful relationship mapping algorithm maps over 1.3 million connections between directors, executives and key business leaders across the globe.

    Accessing the broadest and deepest global corporate governance data set available in the market today, law firms are able to perform a deep-dive on corporate governance practices, enabling them to provide top quality services to their clients, by analyzing their peer practices and quickly spotting potential inefficiencies that may put them at risk of shareholder activism.

    “We’re delighted to partner with CGLytics to deliver law firms with actionable relationship analytics and first-class corporate governance intelligence,” explained Peter Ozolin, CEO from Manzama. “The joint service offerings will allow our customers to easily perform due diligence on key decisionmakers, uncover new connections and find the most effective way to establish relationships with new targets. At the same time obtaining deeper corporate governance intelligence to take their corporate governance advisory work to the next level.”

    Aniel Mahabier, Founder and CEO of CGLytics described the partnership as “one of our most exciting collaborations. Our unique and powerful relationship mapping algorithm combined with actionable corporate governance information in one system will drive law firms to take their business to another level and provide the best possible advice to their clients.”

    Law firms that are interested in easily uncovering new relationships and expanding their business network reach for client management and development activities, along with leveraging best of class corporate governance data, get in touch with Manzama today.

    About Manzama

    Manzama sets the bar when it comes to finding crucial information for organisations. Since 2010, they have been the leading provider of current awareness and market intelligence solutions to professional service organizations around the globe. They provide intuitive search and sharing tools, user-friendly implementation, and integrations into numerous best-in-class third-party platforms. Using sophisticated search algorithms and cutting-edge machine learning techniques, Manzama delivers critical insights that help teams better serve their clients, make informed business decisions, and support knowledge and business development initiatives.

    About CGLytics

    CGLytics is transforming the way corporate governance decisions are made. Combining the broadest corporate governance dataset, with the most comprehensive analytics tools, CGLytics empowers corporations, investors and professional services to instantly perform a governance health check and make better informed decisions. From unique Pay for Performance analytics and peer comparison tools, to board effectiveness insights, companies and investors have access to the most comprehensive source of governance information at their fingertips – powering the insights required for good modern governance.

    With Over 1 Billion Data Points and Powerful Algorithms, CGLytics is Utilised by Leading Investors and Proxy Advisors.

    m2

    5,500+

    Listed Companies

    m4

    125,000+

    C-Level Profiles

    m5

    8 MIL+

    Company Disclosures
    and Filings

    m3

    800 Mil+

    N-PX proxy voting
    resolutions

    m6

    1.3 Mil+

    Relationships Connections

    noun_metrics_1820608 (2) copy

    Key financial metrics from 2008 onwards for predictive analysis and companies top 25 ownership data

    1

    More than ten years of historical compensation data and array of unique performance indicators

    2

    Current and historical board composition, skills data and millions of business relations

    4

    Curated governance news in real-time

    Glass Lewis and CGLytics Establish Global Partnership to Provide Unmatched Compensation Data and Analytics

    Glass Lewis integrates CGLytics data set and analytical tools for its proxy vote recommendations and custom policy offerings

    GL_reversed_logo_horizontal

    Glass Lewis and CGLytics Establish Global Partnership to Provide Unmatched Compensation Data and Analytics

    Glass Lewis integrates CGLytics data set and analytical tools for its proxy vote recommendations and custom policy offerings

    [San Francisco, Amsterdam, London – June 5, 2019] – Glass Lewis, the world’s leading independent provider of governance and engagement support services, and CGLytics, a leading provider of governance data and analytics globally, today announced an expansion of their strategic partnership. CGLytics will serve as the global provider of compensation datasets and analytics to Glass Lewis, with an initial focus on North American, Australian and European markets.

    Building on the success of the firms’ existing European partnership, Glass Lewis will now utilize CGLytics’ extensive compensation data in its proxy research and voting recommendations on executive compensation and Say on Pay, and integrate the same data into the proxy voting policies of institutional investors via its vote management solution, Viewpoint.

    Glass Lewis’ Say on Pay analysis will now also be available via CGLytics’ proprietary platform, giving investors, issuers, advisors and board members the exact same data, tools and insights Glass Lewis uses to review and model CEO and executive compensation plans, and prepare for engagements with all stakeholders. Combining Glass Lewis’ proprietary policies and methodologies and CGLytics’ extensive data and analytical tools, the two companies will give all market participants unprecedented transparency and access into Glass Lewis’ compensation analysis that was not widely available and is needed for successful governance and stewardship in the modern digital age.

    “CGLytics’ software and dataset enables the Glass Lewis global research team to establish a robust and consistent data source for our analysts to use in developing our unparalleled analysis and recommendations on compensation matters,” said Katherine Rabin, CEO of Glass Lewis. “Not only will this benefit our investor clients, who rely on us to provide them in-depth research and accurately implement their custom policies, but also the corporate issuers that directly purchase our Proxy Paper reports as an important part of their preparation to engage with shareholders.”

    “We are thrilled to be extending our partnership with Glass Lewis, especially at a critical moment when corporations and investors are facing increasing demands from multiple parties for greater transparency and socially responsible and sustainable pay practices – all of which are essential to upholding good modern governance,” commented Aniel Mahabier, CEO of CGLytics. “By partnering with Glass Lewis, we will be able to provide corporations and their investors with an unmatched solution to evaluate compensation practices. The extensive toolset and enhanced access to Glass Lewis’ proprietary methodology will help companies and investors effectively connect their analysis, engagement and decision-making, resulting in improved stewardship and shareholder engagement.”

    About Glass Lewis

    Glass Lewis, the leading independent provider of global governance and engagement support services, helps institutional investors understand and connect with companies they invest in. Glass Lewis is a trusted ally of more than 1,300 investors globally who use its high-quality, unbiased Proxy Paper research and industry-leading Viewpoint proxy vote management solution to drive value across all their governance activities.

    About CGLytics

    CGLytics is transforming the way corporate governance decisions are made. Combining the broadest corporate governance dataset, with the most comprehensive analytics tools, CGLytics empowers corporations, investors and professional services to instantly perform a governance health check and make better informed decisions. From unique Pay for Performance analytics and peer comparison tools, to board effectiveness insights, companies and investors have access to the most comprehensive source of governance information at their fingertips – powering the insights required for good modern governance.

    With Over 1 Billion Data Points and Powerful Algorithms, CGLytics is Utilised by Leading Investors and Proxy Advisors.

    m2

    5,500+

    Listed Companies

    m4

    125,000+

    C-Level Profiles

    m5

    8 MIL+

    Company Disclosures
    and Filings

    m3

    800 Mil+

    N-PX proxy voting
    resolutions

    m6

    1.3 Mil+

    Relationships Connections

    noun_metrics_1820608 (2) copy

    Key financial metrics from 2008 onwards for predictive analysis and companies top 25 ownership data

    1

    More than ten years of historical compensation data and array of unique performance indicators

    2

    Current and historical board composition, skills data and millions of business relations

    4

    Curated governance news in real-time