2019 CEO Pay Review: The Top 50 Highest Paid CEOs

As proxy season progresses and companies file their annual reports, CGLytics surveys the world’s highest paid CEOs (so far) and looks at how executive compensation has grown since the last year.

CEO Pay continued to dominate the AGM season in 2019. As we take a break over the summer, it’s worth reviewing the top 50 highest paid CEOs and seeing how this has changed from 2018.

We also take a look at how the performance of these companies has increased to understand how executives are rewarded for performance.

Key CEO pay take aways from the first half of 2019 :

  • The top 50 total granted compensation has increased by over 300% from 2018 to 2019 ($4.49bn compared to $1.12bn).
  • Although over 50% of the $4.4bn is attributable to one individual’s granted compensation (Elon Musk, Tesla: $2.28bn).
  • Even discounting this outlier, total granted executive compensation increased by 97%.
  • Meanwhile the average growth in market capitalisation was around 3% from 2018.
  • And 1 year Total Shareholder Return (TSR) actually shrank by 1%.


Given these significant increases in total granted compensation compared to the value being delivered to shareholders, it’s easy to see why CEO pay and compensation continues to dominate AGM discussions.

Trending Top 50 CEOs

Ranking

CEO

Company

Total Granted
Compensation

Total Realised Pay

TSR in %

TSR 1YR growth in
%point

1

Musk, Elon

Tesla, Inc.

$2,284,044,884
(
54575310%)

$56,380 (513%)

57%

515%

2

Smith, Patrick

Axon Enterprise, Inc.

$246,026,710
(
56433%)

$25,488,720
(
5472%)

565%

592%

3

Zaslav, David

Discovery Communications, Inc.

$129,499,005
(
5207%)

$33,498,259
(
662%)

511%

543%

4

Glancey, Stephen

C&C Group plc

$119,819,023
(
510%)

$1,643,004
(
536%)

50%

62%

5

Hodler, Bernhard

Julius Baer Group Ltd.

$78,813,367
(
54694%)

$2,979,804
(
581%)

640%

639%

6

Levine, Jay

OneMain Holdings, Inc.

$71,532,583
(
516913%)

$71,532,583
(
516913%)

67%

62%

7

Schwarzman, Stephen

The Blackstone Group L.P.

$69,147,028
(
645%)

$69,147,028
(
645%)

50%

51%

8

Legere, John

T-Mobile US, Inc.

$66,538,206
(
5270%)

$42,071,611
(
5243%)

50%

57%

9

Iger, Robert

The Walt Disney Company

$65,645,214
(
581%)

$66,065,073
(
68%)

54%

56%

10

Steele, Gary

Proofpoint, Inc.

$64,730,296
(
5892%)

$54,931,367
(
528%)

66%

510%

11

Charlès, Bernard

Dassault Systèmes SE

$51,098,970
(
577%)

$65,983,199
(
578%)

518%

517%

12

Alber, Laura

Williams-Sonoma, Inc.

$50,758,332
(
5252%)

$28,830,401
(
5224%)

51%

63%

13

Heppelmann, James

PTC Inc.

$49,969,163
(
5403%)

$17,041,464
(
5107%)

536%

546%

14

Freda, Fabrizio

The Estée Lauder Companies Inc.

$48,753,819
(
50%)

$9,387,109
(
683%)

53%

56%

15

Buckley, Henry

Uni-Select Inc.

$47,774,090
(
52687%)

$47,012,426
(
53416%)

630%

634%

16

Handler, Richard

Jefferies Financial Group Inc.

$44,674,213
(
5105%)

$5,951,709
(
5339%)

633%

638%

17

Kilroy, John

Kilroy Realty Corporation

$43,624,774
(
5282%)

$18,204,958
(
622%)

614%

610%

18

Bird, Lewis

At Home Group Inc.

$43,089,790
(
52477%)

$1,614,791
(
63%)

639%

632%

19

Lebda, Douglas

LendingTree, Inc.

$42,318,238
(
629%)

$164,584,011
(
53682%)

636%

628%

20

MacMillan, Stephen

Hologic, Inc.

$42,040,142
(
5275%)

$12,231,622
(
656%)

64%

56%

21

Hogan, Joseph

Align Technology, Inc.

$41,758,338
(
5256%)

$69,763,660
(
5504%)

66%

61%

22

Schulman, Daniel

PayPal Holdings, Inc.

$37,764,588
(
596%)

$41,295,115
(
5328%)

514%

517%

23

Hastings, Reed

Netflix, Inc.

$36,080,417
(
548%)

$4,064,854
(
698%)

539%

547%

24

Roberts, Brian

Comcast Corporation

$35,026,207
(
58%)

$47,400,117
(
640%)

613%

613%

25

Jellison, Brian

Roper Technologies, Inc.

$34,931,318
(
520%)

$142,847,568
(
5103%)

54%

59%

26

Wenig, Devin

eBay Inc.

$34,842,832
(
597%)

$19,946,164
(
566%)

626%

628%

27

Thiry, Kent

DaVita Inc.

$32,017,501
(
5109%)

$13,983,054
(
610%)

629%

632%

28

Kotick, Robert

Activision Blizzard, Inc.

$30,841,004
(
57%)

$4,307,586
(
697%)

626%

622%

29

Wichmann, David

UnitedHealth Group Incorporated

$30,824,112
(
577%)

$22,558,157
(
673%)

515%

518%

30

Dimon, James

JPMorgan Chase & Co.

$30,033,745
(
56%)

$18,136,934
(
687%)

67%

68%

31

Lutnick, Howard

BGC Partners, Inc.

$29,694,152
(
589%)

$17,791,850
(
511%)

643%

659%

32

Stephenson, Randall

AT&T Inc.

$29,118,118
(
51%)

$21,606,548
(
614%)

622%

69%

33

Narayen, Shantanu

Adobe Systems Incorporated

$28,397,528
(
529%)

$67,297,455
(
555%)

529%

534%


Benioff, Marc

salesforce.com, inc.

$28,391,846
(
5510%)

$44,183,075
(
662%)

534%

549%

35

Moghadam, Hamid

Prologis, Inc.

$28,201,397
(
546%)

$35,887,540
(
56%)

66%

516%

36

Gorman, James

Morgan Stanley

$28,168,639
(
515%)

$19,299,856
(
652%)

623%

624%

37

Florance, Andrew

CoStar Group, Inc.

$27,555,954
(
5159%)

$18,644,383
(
517%)

514%

520%

38

Greenberg, Robert

Skechers U.S.A., Inc.

$27,361,406
(
5252%)

$11,157,656
(
515%)

640%

637%

39

Umpleby, D.

Caterpillar Inc.

$27,289,513
(
594%)

$14,840,544
(
5171%)

618%

616%

40

Fink, Laurence

BlackRock, Inc.

$26,543,344
(
64%)

$51,471,260
(
561%)

622%

621%

41

Schleifer, Leonard

Regeneron Pharmaceuticals, Inc.

$26,520,555
(
50%)

$117,840,017
(
524%)

61%

56%

42

Chenault, Kenneth

American Express Company

$24,208,661
(
530%)

$54,431,474
(
642%)

63%

61%

43

Holmes, Stephen

Wyndham Worldwide Corporation

$21,479,166
(
542%)

$50,161,004
(
553%)

629%

669%

44

Johnson, R.

HCA Healthcare, Inc.

$21,419,906
(
524%)

$109,050,692
(
51407%)

543%

544%

45

Banga, Ajaypal

MasterCard Incorporated

$20,379,353
(
59%)

$60,704,447
(
5145%)

525%

528%

46

Brown, Gregory

Motorola Solutions, Inc.

$20,348,558
(
533%)

$69,555,180
(
5137%)

530%

535%

47

Minogue, Michael

ABIOMED, Inc.

$19,243,230
(
587%)

$123,043,867
(
5907%)

573%

585%

48

Casper, Marc

Thermo Fisher Scientific Inc.

$18,607,103
(
616%)

$85,476,755
(
5161%)

518%

524%

49

Meyer, James

Sirius XM Holdings Inc.

$17,633,953
(
582%)

$50,452,233
(
5331%)

57%

56%

50

Fairbank, Richard

Capital One Financial Corporation

$17,333,796
(
57%)

$108,527,637
(
557%)

623%

622%

[1] Compensation in USD – exchange rates based on single point of time, end of tax year 2018.

[2] Excludes executives appointed since 2017 season.

Want to know the impact COVID-19 has had on executive compensation?

Download our latest whitepaper to learn how you can address a range of governance, design and administration challenges that involve executive and non-employee director compensation programs.

Latest Industry News, Views & Information

How the SEC’s new proxy voting rules will impact executive compensation

There are many software applications and tools now available to support compensation decisions, but what should be taken into consideration before purchasing? This 5-minute guide details what Compensation Committees, Heads of Reward and Compensation Professionals should take into account when selecting software and tools for Say-on-Pay decisions.

S&P 500 Banking Industry’s Response to COVID-19

CGLytics examines how S&P 500 banks responded to the volatility of the pandemic prior to the Fed’s announcement to cap bank dividends and prohibit share repurchases until Q4 following its annual stress test of banks.

How to independently and efficiently benchmark executive compensation for Say-on-Pay

There are many software applications and tools now available to support compensation decisions, but what should be taken into consideration before purchasing? This 5-minute guide details what Compensation Committees, Heads of Reward and Compensation Professionals should take into account when selecting software and tools for Say-on-Pay decisions.

Data puts CEO rewards into perspective in the Netherlands

In this article, originally published in Dutch in Mgmt. Scope, CGLytics examines CEO pay in the Netherlands and how it is one of the hottest topics in shareholder discussions.

This article on CEO pay in the Netherlands first appeared in Dutch in Mgmt. Scope on 27th May 2019: https://managementscope.nl/online/data-zet-beloning-ceo-in-perspectief

Shareholders are making themselves heard more than ever about the strategy of the company. Certainly the remuneration of directors has gained much attention. Corporate governance analytics – the specialization of CGLytics – helps to separate the facts from the opinions in regards to remuneration policies. This is also not a superfluous luxury: data shows that shareholders are quite rightly concerned.

In recent years, shareholders have been expressing themselves more and more emphatically at General Meetings of Shareholders (AGMs). In 2018, the average number of votes cast at the AGMs of AEX companies reached a record level of 72.4 percent. Never before have shareholders voted so massively on the issues that concern them. The most important topic from a distance: the remuneration of directors. The figures for 2019 are not yet complete, but the same picture emerges.

Remuneration of directors

What does the data say? The remuneration policy, and certainly the alignment of the CEO’s remuneration, keeps the minds of shareholders busy. The average percentage of votes against the remuneration policy of all Dutch listed companies rose to 16.5 percent in 2018. That is more than double the average for the combined years of 2015, 2016 and 2017. The media is also paying more and more attention to the remuneration policy of companies. These are important reasons to take any adjustments to the remuneration policy very seriously. Paying attention to remuneration fits in with the development of corporate social responsibility (ESG practices). Companies must be able to indicate how the remuneration of the CEO contributes to long-term value creation. They must also be willing to discuss their performance in this area. For example, in the amended corporate governance code, the disclosure of the relationship between the remuneration of CEOs and the average employee is already mandatory. The legislation is expected to follow soon.

Pay for performance

An important indicator for value creation in the long term is pay for performance, or the ratio between remuneration and performance. There is still a lot for companies to do in this area. Data from CGLytics shows that the financial performance of companies and the rewards of their CEOs are poorly aligned. 44 percent of the 25 AEX companies – measured over the 2017 financial year – have an imbalance between remuneration and performance. Which means the CEO’s remuneration is higher than expected based on the company’s performance. Over a three-year period, 2015-2017, this is 38 percent. There is also good news. Over the past five years, AEX companies have found a better mix between fixed, short-term and long-term bonuses in their remuneration policy for directors. The average basic salary and the long-term bonuses increased, while the size of the short-term bonuses decreased. It is generally accepted that a fixed compensation and long-term bonuses do more for long-term value creation for stakeholders.

Data provides insight

Data therefore offers important insights; not just for shareholders. It is not for nothing that an increasing number of directors, supervisors, remuneration committees and investors use corporate governance data to test the remuneration policy. Data helps determine an adequate remuneration structure and makes it possible to distinguish the facts from the opinions.

Latest Industry News, Views & Information

Understanding ESG & Annual Incentive Plan

Understanding ESG & Annual Incentive Plan ESG refers to a series of environmental, social and governance criteria taken into consideration by the funds during the investing process. Investing in ESG funds allows shareholders to support companies in transition, that wish to act and develop in a more sustainable and responsible manner. In practice, many indicators … Continue reading “Understanding ESG & Annual Incentive Plan”

Pay for Performance: The Largest Institutional Investors’ View

Pay for Performance: The Largest Institutional Investors’ View   Executive compensation has been one of the trickiest issues within the corporate governance space as of late. Across the board, there seems to be no end in sight to finding the perfect compensation package or philosophy for corporate executives. In this article, we will discuss the … Continue reading “Pay for Performance: The Largest Institutional Investors’ View”

How to design your peer group for compensation benchmarking

How to design your peer group for compensation benchmarking   Given the scrutiny on executive compensation in recent years, it is critical to make sure that your company’s executive pay reflects its performance and aligns with the market. Therefore, it is essential for companies to have an appropriate peer group for performance benchmarking, compensation program … Continue reading "How to design your peer group for compensation benchmarking"

The Top 50 Highest Paid CEOs

As proxy season progresses and companies file their annual reports, CGLytics surveys the world’s highest paid CEOs (so far) and looks at how executive compensation has grown since the last year.

CEO pay and compensation continues to be one of the most hotly debated topics in the 2019 Proxy Season with companies and individuals regularly under scrutiny by investors and the media.

Utilising our deep, global data set, sourced from the filings and published returns of over 5,500 publicly listed companies, CGLytics examines the top 50 highest paid CEOs across the globe to have had their 2018 Total Granted Compensation (TGC)[1] and Total Realized Pay (TRP) published in 2019.

Key findings:

  • Total Granted Compensation for the top 50 CEOs was over $1.82bn, more than the GDP of 21 National Economies.
  • Average Total Granted Compensation for 2018 was $37,030,673.71, an increase of 62% from 2017.
    Average Total Realised Pay was $37,909,498.5, an increase of 4.4% from 2017.
  • The top 5 CEOs accounted for over 27% of the total Total Granted Compensation for 2017.
  • Total Shareholder Return decreased by an average of 6% across the group, indicating that this season, Pay for Performance is going to be a contentious topic as shareholders continue to challenge misaligned compensation packages.


This research is updated on a bi-weekly basis, with the latest information taken from May 3, 2019. It will be updated to reflect the top 50 CEOs as companies publish their annual results through to the end of the 2019 Proxy Season.

Trending Top 50 CEOs


Ranking

CEO

Company

Change in rank (since 18 April)

Total Granted Compensation

Total Realised Pay

TSR in %

TSR 1YR growth in %point

1

Zaslav, David

Discovery
Communications, Inc.


 $129,499,005 (5207%)

 $33,498,259 (662%)

11%

29%

2

Hurd, Mark

Oracle Corporation


 $108,295,023 (5165%)

 $26,690,273 (583%)

63%

628%

3

Catz, Safra

Oracle Corporation


 $108,282,333 (5166%)

 $162,740,735 (520%)

63%

628%

4

Hodler, Bernhard

Julius Baer Group Ltd.


 $78,813,367 (54544%)

 $2,979,804
(576%)

640%

675%

5

Levine, Jay

OneMain Holdings, Inc.

new

 $71,532,583 (516913%)

 $71,532,583 (516913%)

67%

624%

6

Schwarzman, Stephen

The Blackstone Group L.P.

-1

 $69,147,028 (645%)

 $69,147,028 (645%)

0%

27%

7

Iger, Robert

The Walt Disney
Company

-1

 $65,645,214 (581%)

 $66,065,073 (68%)

4%

61%

8

Charlès, Bernard

Dassault Systèmes SE

new

 $51,098,970
(564%)

 $65,983,199 (564%)

18%

66%

9

Heppelmann, James

PTC Inc.

-2

 $49,969,163 (5403%)

 $17,041,464 (5107%)

36%

5%

10

Freda, Fabrizio

The Estée Lauder Companies Inc.

-2

 $48,753,819 (0%)

 $9,387,109
(683%)

3%

665%

11

Handler, Richard

Jefferies Financial
Group Inc.

-2

 $44,674,213 (5105%)

 $5,951,709 (5339%)

633%

649%

12

Kilroy, John

Kilroy Realty Corporation

new

 $43,624,774 (5282%)

 $18,204,958 (622%)

614%

618%

13

MacMillan, Stephen

Hologic, Inc.

-3

 $42,040,142 (5275%)

 $12,231,622 (656%)

64%

610%

14

Hogan, Joseph

Align Technology, Inc.

new

 $41,758,338 (5256%)

 $69,763,660 (5504%)

66%

6137%

15

Schulman, Daniel

PayPal Holdings,
Inc.

new

 $37,764,588 (596%)

 $41,295,115 (5328%)

14%

672%

16

Lawrie, John

DXC Technology Company

-5

 $32,185,309 (572%)

 $7,105,877
(676%)

635%

17

Dimon, James

JPMorgan Chase &
Co.

new

 $30,033,745 (56%)

 $18,136,934 (687%)

67%

633%

18

Stephenson, Randall

AT&T Inc.

-6

 $29,118,118 (51%)

 $21,606,548
(614%)

622%

618%

19

Narayen, Shantanu

Adobe Systems
Incorporated

-6

 $28,397,528 (529%)

 $67,297,455 (555%)

29%

641%

20

Moghadam, Hamid

Prologis, Inc.

-6

 $28,201,397 (546%)

 $35,887,540 (56%)

66%

632%

21

Greenberg, Robert

Skechers U.S.A.,
Inc.

new

 $27,361,406 (5252%)

 $11,157,656 (515%)

640%

693%

22

Garrabrants, Gregory

BofI Holding, Inc.

-7

 $26,975,924 (5299%)

 $12,708,360 (568%)

616%

621%

23

Strangfeld, John

Prudential
Financial, Inc.

-7

 $26,696,966 (62%)

 $15,525,376 (649%)

626%

640%

24

Milligan, John

Gilead Sciences Inc.

-7

 $25,961,831 (568%)

 $21,781,701 (54%)

610%

613%

25

Nadella, Satya

Microsoft
Corporation

-7

 $25,843,263 (529%)

 $34,874,210 (517%)

21%

620%

26

Nooyi, Indra

Pepsico, Inc.

-7

 $24,491,117 (621%)

 $26,276,686 (668%)

65%

623%

27

White, Miles

Abbott Laboratories

-7

 $24,254,238 (528%)

 $31,646,904 (51%)

29%

623%

28

Chenault, Kenneth

American Express Company

-7

 $24,208,661 (530%)

 $54,431,474
(642%)

63%

639%

29

Bush, Wesley

Northrop Grumman
Corporation

-7

 $24,185,259 (528%)

 $34,319,926 (51%)

619%

653%

30

Corbat, Michael

Citigroup Inc.

-7

 $24,183,714 (536%)

 $20,164,941 (534%)

628%

656%

31

Wren, John

Omnicom Group Inc.

new

 $23,945,128 (0%)

 $23,633,099 (59%)

4%

16%

32

Lance, Ryan

ConocoPhillips

-8

 $23,406,270 (57%)

 $21,852,860 (528%)

16%

4%

33

Muilenburg, Dennis

The Boeing Company

-8

 $23,392,187 (527%)

 $31,334,957 (519%)

12%

683%

34

Blankfein, Lloyd

The Goldman Sachs Group, Inc.

-8

 $23,390,658 (56%)

 $6,617,836
(677%)

634%

641%

35

Moynihan, Brian

Bank of America
Corporation

-8

 $22,754,510 (54%)

 $25,330,434 (525%)

615%

651%

36

Hewson, Marillyn

Lockheed Martin Corporation

-8

 $22,717,004 (61%)

 $34,148,718 (53%)

616%

648%

37

Miller, Alan

Universal Health
Services, Inc.

new

 $22,588,883 (54%)

 $6,324,536 (683%)

3%

64%

38

Osuna Gómez, Juan

Obrascón Huarte Lain, S.A.

new

 $22,331,445 (5755%)

 $22,331,445
(5755%)

686%

6137%

39

Tyagarajan, NV

Genpact Limited

new

 $22,299,191 (5608%)

 $1,738,855 (664%)

614%

646%

40

Nanterme, Pierre

Accenture plc

-11

 $22,299,174 (513%)

 $29,414,791 (531%)

66%

640%

41

Messina, Carlo

Intesa Sanpaolo
S.p.A.

-11

 $22,182,562 (5193%)

 $5,842,684 (523%)

625%

647%

42

Holmes, Stephen

Wyndham Worldwide Corporation

new

 $21,479,166 (542%)

 $50,161,004 (553%)

629%

684%

43

Johnson, R.

HCA Healthcare, Inc.

-12

 $21,419,906 (524%)

 $109,050,692 (51407%)

43%

25%

44

Novakovic, Phebe

General Dynamics Corporation

-12

 $20,720,254 (64%)

 $41,885,999 (513%)

621%

641%

45

Brown, Gregory

Motorola Solutions,
Inc.

-12

 $20,348,558 (533%)

 $69,555,180 (5137%)

30%

18%

46

Gorsky, Alex

Johnson & Johnson

-12

 $20,097,572 (633%)

 $46,428,340 (555%)

65%

630%

47

Read, Ian

Pfizer Inc.

-12

 $19,549,213 (630%)

 $47,042,550 (567%)

25%

9%

48

Casper, Marc

Thermo Fisher Scientific Inc.

new

 $18,607,103 (616%)

 $85,476,755 (5161%)

18%

617%

49

Allen, Samuel

Deere & Company

-13

 $18,525,667 (515%)

 $44,767,370 (5155%)

63%

658%

50

Hammergren, John

McKesson Corporation

-13

 $18,143,017 (610%)

 $63,161,402 (635%)

628%

640%

[1] Compensation in USD – exchange rates based on single point of time, end of tax year 2018.

[2] Excludes executives appointed since 2017 season.

Latest Industry News, Views & Information

How the SEC’s new proxy voting rules will impact executive compensation

There are many software applications and tools now available to support compensation decisions, but what should be taken into consideration before purchasing? This 5-minute guide details what Compensation Committees, Heads of Reward and Compensation Professionals should take into account when selecting software and tools for Say-on-Pay decisions.

S&P 500 Banking Industry’s Response to COVID-19

CGLytics examines how S&P 500 banks responded to the volatility of the pandemic prior to the Fed’s announcement to cap bank dividends and prohibit share repurchases until Q4 following its annual stress test of banks.

How to independently and efficiently benchmark executive compensation for Say-on-Pay

There are many software applications and tools now available to support compensation decisions, but what should be taken into consideration before purchasing? This 5-minute guide details what Compensation Committees, Heads of Reward and Compensation Professionals should take into account when selecting software and tools for Say-on-Pay decisions.

Review of FTSE 100 2018 Proxy Season – Getting ready for next proxy season

The report provides boards with key insights and takeaways from the 2018 proxy season, in order to aid preparation and ensure companies are adequately prepared to engage.

Getting Ready for the Next Proxy Season: 2018 FTSE 100 Proxy Review

In preparation for the 2019 proxy season, CGLytics has released its third annual FTSE 100 Proxy Season report. The report provides boards with key insights and takeaways from the 2018 proxy season, in order to aid preparation and ensure companies are adequately prepared to engage.

Key Takeaways:

The 2018 proxy season saw a higher dissent from shareholders on director re-elections than previous years. This sends a strong message to directors that they will be held directly accountable for their individual actions.

The report highlights an increasing focus from investors on key governance issues such as disclosure quality, director election, board effectiveness, CEO pay and Environmental Social Governance (ESG) practices.

Once again CEO pay continued to be a key theme with shareholders concerned with pay equity, transparency, executive pay levels, and pay for performance. In particular, pay for performance is a main area of concern for investors, and the CGLytics study shows that almost a third of the FTSE 100 companies have significant misalignment between pay and performance over a one and three year period.

DOWNLOAD THE REPORT

Latest Industry News, Views & Information

  • All
  • Blog

Understanding ESG & Annual Incentive Plan

Understanding ESG & Annual Incentive Plan ESG refers to a series of environmental, social and governance criteria taken into consideration by the funds during the investing process. Investing in ESG funds allows shareholders to support companies in transition, that wish to act and develop in a more sustainable and responsible manner. In practice, many indicators … Continue reading “Understanding ESG & Annual Incentive Plan”

Pay for Performance: The Largest Institutional Investors’ View

Pay for Performance: The Largest Institutional Investors’ View   Executive compensation has been one of the trickiest issues within the corporate governance space as of late. Across the board, there seems to be no end in sight to finding the perfect compensation package or philosophy for corporate executives. In this article, we will discuss the … Continue reading “Pay for Performance: The Largest Institutional Investors’ View”

How to design your peer group for compensation benchmarking

How to design your peer group for compensation benchmarking   Given the scrutiny on executive compensation in recent years, it is critical to make sure that your company’s executive pay reflects its performance and aligns with the market. Therefore, it is essential for companies to have an appropriate peer group for performance benchmarking, compensation program … Continue reading "How to design your peer group for compensation benchmarking"

The EU Shareholder Rights Directive: The implications for executive compensation in Belgium and Luxembourg

The corporate governance landscape is changing. Listed EU companies are increasingly subject to more disclosure and transparency requirements while executive compensation is now under greater scrutiny than ever. In this article CGLytics takes a look at the implications of the EU Shareholder Rights Directive on executive compensation in Belgium and Luxembourg

The corporate governance landscape is changing. Listed EU companies are increasingly subject to more disclosure and transparency requirements while executive compensation is now under greater scrutiny than ever. Part of the call for greater transparency applies to the compensation of top executives of listed companies. Shareholders now have the right to an extended say on pay under the Revised Shareholders’ Rights Directive (SRD II) through their votes on the remuneration policy and report.

The EU SRD II: It’s Main Purpose

  1. To encourage long-term shareholder engagement by facilitating the exercise of shareholder rights
  2. To enhance transparency
  3. To increase directors’ accountability and reinforce the link between pay and company directors’ performance

Impact for companies

Under SRD II – Extension of shareholders’ right to say on pay

The SRD II requires the compensation of all directors to be reported on an individual basis. This will impact Belgium listed companies as previously it was deemed sufficient to provide this information on an aggregated basis.

Another change is the impact of shareholders’ votes on the remuneration policy, empowering them to oversee and influence directors’ remuneration. The shareholders’ vote on the remuneration report is not new, however, the content of the remuneration report will have to be more extensive and explicit to comply with SRD II. In particular, next year’s report will have to explain how the shareholders’ vote on the remuneration report was taken into account.

The most innovative change is the requirement to explain the changes in directors’ pay in relation to the evolution of the company’s performance and employees’ average pay during the period under examination. This will put the emphasis on the compensation committee to provide increasingly data driven analysis against a variety to financial and non-financial KPIs.

In the future – Disclosure of the CEO pay ratio?

The CEO pay ratio is the indicator of CEO compensation compared with employees’ pay, usually expressed by a multiple of the median annual salary of the employees of the company concerned. Currently, the pay ratio is not part of the disclosure requirements under European corporate governance regulations, in contrast with the US and the UK.

In the US for example, public companies are required to disclose the ratio of CEO pay to median employee pay in their proxy statement. In the UK, listed companies with more than 250 employees are required to disclose the ratio of their CEO’s total remuneration to the median (50th), 25th and 75th percentile full-time equivalent remuneration of their UK employees.

The future will tell us whether the disclosure of CEO pay ratios affects companies’ executive compensation practices. It cannot be ruled out that other governments will follow the path taken by the US and the UK in order to manage the perception of executive remuneration being increasingly out of step with the average employee pay.

Fair pay

Fairness in pay is not only about being transparent on the remuneration and the wage gap between CEOs/executives and employees. Fair pay also means non-discrimination between employees.

Significant developments are occurring worldwide regarding gender discrimination. Measures adopted to tackle this issue vary from country to country. Such measures may consist of transparency requirements (e.g. in Germany), the obligation to report on the gender pay gap in the company’s annual report (e.g. in the UK), the requirement to have a gender pay gap analysis conducted by independent and external bodies (e.g. in Switzerland) or mandatory equal pay certification (e.g. in Iceland – such legislation is under discussion in the Netherlands).

In Belgium, equal treatment is enshrined in the Belgian Constitution and in the Non-Discrimination Act, which prohibits any direct or indirect discrimination based on certain grounds, including in employment relations. Under the Gender Non-Discrimination Act, companies employing at least 50 employees are required to conduct a detailed analysis of their remuneration structure – to ensure a gender-neutral remuneration policy – every two years and deliver their report to the employee representative body.

To date, Belgian companies are not required to disclose their gender pay gap in their annual report or in their remuneration policies or report. Nevertheless, the information contained in the company’s social balance sheet must be broken down by gender. In addition, listed companies are required to describe their diversity policy in their Corporate Governance Statement.

In Luxembourg, labour law prohibits companies from using criteria other than knowledge, experience and responsibilities to determine remuneration. Despite initiatives of the Ministry of Equal Opportunities to raise awareness on the gender pay gap, no further legal provisions exist on this matter.

To this end, companies in Belgium and Luxembourg will be required to show greater transparency of executive and director pay, not just in comparison against the performance of the organisation, but also ensuring that it is benchmarked against the growth (or decline) of the average employee. Shareholders will have more information and greater powers to curtail excess pay, while holding companies to account against more financial and non-financial KPIs.

Take a deeper dive into executive compensation practices

With a wealth of global data, analytics and insights, review executive pay against an array of key financial indicators.

Replicate the peer groups of leading proxy advisors and investors, and instantly compare CEO pay against company performance and their peers.

Click here to download the Corporate Governance and Executive Pay: Legislative landscape and market insights report, produced together with PwC.

REQUEST A DEMO

Latest Industry News, Views & Information

Understanding ESG & Annual Incentive Plan

Understanding ESG & Annual Incentive Plan ESG refers to a series of environmental, social and governance criteria taken into consideration by the funds during the investing process. Investing in ESG funds allows shareholders to support companies in transition, that wish to act and develop in a more sustainable and responsible manner. In practice, many indicators … Continue reading “Understanding ESG & Annual Incentive Plan”

Pay for Performance: The Largest Institutional Investors’ View

Pay for Performance: The Largest Institutional Investors’ View   Executive compensation has been one of the trickiest issues within the corporate governance space as of late. Across the board, there seems to be no end in sight to finding the perfect compensation package or philosophy for corporate executives. In this article, we will discuss the … Continue reading “Pay for Performance: The Largest Institutional Investors’ View”

How to design your peer group for compensation benchmarking

How to design your peer group for compensation benchmarking   Given the scrutiny on executive compensation in recent years, it is critical to make sure that your company’s executive pay reflects its performance and aligns with the market. Therefore, it is essential for companies to have an appropriate peer group for performance benchmarking, compensation program … Continue reading "How to design your peer group for compensation benchmarking"

Dominant themes from the 2018 AEX proxy season and what to expect in 2019

During the 2018 Dutch proxy season, shareholders actively engaged in a range of governance matters, with CEO remuneration remaining a key focus for stakeholders and widely publicised by the media. And, as always, the upcoming 2019 proxy season is likely to be influenced by happenings from the previous year.

During the 2018 Dutch proxy season, shareholders actively engaged in a range of governance matters, with CEO remuneration remaining a key focus for stakeholders and widely publicised by the media. And, as always, the upcoming 2019 proxy season is likely to be influenced by happenings from the previous year.

As it was the first year that Dutch companies had to comply with the revised Dutch Corporate Governance Code 2016, long-term value creation and CEO-to-average employee pay ratios were reported and picked up by the media. Alignment between CEO pay and performance was again taken into account, and CGLytics’ AEX Proxy Review revealed 44% of companies showed a misalignment between CEO pay and performance over a one year period.

Key themes that dominated the 2018 proxy season that will again be in the spotlight in 2019:

Long-term value creation

Investors will be looking for transparency on how companies’ strategies support long-term value creation, including evaluating the merits of companies’ goals, the internal culture and how they plan to minimise exposure to governance risks.

CEO-to-employee pay ratios

As this became mandatory, companies methodology on measuring CEO-to-average-employee pay ratios varied widely, indicating a more uniformed reporting method is required for fair and accurate measurement. Companies that displayed a large gap were called out by the media in 2018, which should be a consideration for Dutch companies going forward. Companies should expect and be ready to disclose and discuss reported figures.

CEO pay for performance alignment

CGLytics Pay for Performance Study conducted on the AEX 25 companies revealed 44% of companies were misaligned over one year, and 38% were misaligned over a three-year basis. Although these numbers appear significant, it was perceived that there was improvement in the balancing of compensation of AEX CEO’s over the long-term.

The reporting of CEO pay for performance will continue to be a hot topic in the 2019 proxy season, and companies can expect pressure from media, public and shareholders if any extreme executive pay policies and practices are revealed.

Getting ready for the upcoming season

Boards need to be fully prepared to engage during the upcoming proxy season. They must be equally, if not better, informed as shareholders, so they can engage constructively and avoid any reputational risks. Having access to the same intelligence and benchmarking tools as proxy advisors and investors is imperative to prepare.

Click here to download your copy of the CGLytics’ 2018 AEX Proxy Review: Shining the light on pay practices

Aniel Mahabier

CGLytics

Latest Industry News, Views & Information

How the SEC’s new proxy voting rules will impact executive compensation

There are many software applications and tools now available to support compensation decisions, but what should be taken into consideration before purchasing? This 5-minute guide details what Compensation Committees, Heads of Reward and Compensation Professionals should take into account when selecting software and tools for Say-on-Pay decisions.

S&P 500 Banking Industry’s Response to COVID-19

CGLytics examines how S&P 500 banks responded to the volatility of the pandemic prior to the Fed’s announcement to cap bank dividends and prohibit share repurchases until Q4 following its annual stress test of banks.

How to independently and efficiently benchmark executive compensation for Say-on-Pay

There are many software applications and tools now available to support compensation decisions, but what should be taken into consideration before purchasing? This 5-minute guide details what Compensation Committees, Heads of Reward and Compensation Professionals should take into account when selecting software and tools for Say-on-Pay decisions.

What’s New for the 2019 Proxy Season?

By looking at the UK, which currently has the spotlight on corporate governance practices, we can be sure that company boards will be compelled to implement good governance practices.

During the 2018 proxy season, shareholders engaged actively in governance matters. The CGLytics FTSE 100 Proxy Review revealed shareholders to be particularly interested in director election, board effectiveness, CEO pay and Environmental Social Governance (ESG) practice.  So what’s in store for 2019?

By looking at the UK, which currently has the spotlight on corporate governance practices, we can be sure that company boards will be compelled to implement good governance practices. They should prepare for early engagement with investors, who have expanded their ESG capabilities with access to best-in-class analytics to aid engagement and voting.

CEO Pay, Board Refreshment and Gender Diversity will continue to dominate

We envisage the following themes will dominate 2019 across Europe:

Proactive shareholder engagement 

To obtain early shareholder buy-in during the proxy season. Investors will favour an ongoing positive dialogue in preference to a reaction to a negative vote.

Transparency will endure as a central theme 

Boards should be prepared to engage openly on their board composition, say-on-pay proposals and governance decisions.

Board refreshment, gender diversity and board composition 

These will be key governance matters as investors seek to favour board strategy and composition that ties to long-term company performance.

CEO Pay 

Pay will be scrutinised – compensation policies and practices must be fully transparent and reflect, and support, business strategy and promote long-term success.

CEO succession planning 

Chairs and nomination and governance committees will be required to plan for CEO succession to mitigate business continuity risk.

Environmental, Social and Governance (ESG) 

ESG will continue to gain momentum as investors continue to become more information savvy and continue to evaluate companies’ progress on their environmental, social and governance practices.

Boards must be equally, if not better, informed as shareholders in order to engage adequately and constructively

Getting ready for the coming season

Boards need to be fully prepared for the upcoming proxy season. They must be equally, if not better, informed as shareholders in order to engage adequately and constructively, to be certain to avoid any reputational risks. Having access to the same intelligence as proxy advisors and investors is fundamental to proxy season preparedness and good governance decision-making.

CGLytics provides real-time governance risk analytics and solutions that provide actionable insight for companies, shareholders and proxy advisors. We empower boards of companies and investors with data analytics that enable good governance.

In preparation for the 2019 proxy season, CGLytics released its third annual FTSE 100 Proxy Season report. This series of articles summarise some of the key findings. Access the full insights and statistics by downloading the report.

Aniel Mahabier

CGLytics

Latest Industry News, Views & Information

How the SEC’s new proxy voting rules will impact executive compensation

There are many software applications and tools now available to support compensation decisions, but what should be taken into consideration before purchasing? This 5-minute guide details what Compensation Committees, Heads of Reward and Compensation Professionals should take into account when selecting software and tools for Say-on-Pay decisions.

S&P 500 Banking Industry’s Response to COVID-19

CGLytics examines how S&P 500 banks responded to the volatility of the pandemic prior to the Fed’s announcement to cap bank dividends and prohibit share repurchases until Q4 following its annual stress test of banks.

How to independently and efficiently benchmark executive compensation for Say-on-Pay

There are many software applications and tools now available to support compensation decisions, but what should be taken into consideration before purchasing? This 5-minute guide details what Compensation Committees, Heads of Reward and Compensation Professionals should take into account when selecting software and tools for Say-on-Pay decisions.

Be prepared: Learnings from the UK 2018 proxy season

The UK is at the forefront of shareholder concern of good corporate governance practices. In a climate of increasing proactive shareholder engagement, the CGLytics FTSE 100 2018 proxy season review evaluates underlying trends to provide unique insights for being prepared for the forthcoming season.

The UK is at the forefront of shareholder concern of good corporate governance practices. In a climate of increasing proactive shareholder engagement, the CGLytics FTSE 100 2018 proxy season review evaluates underlying trends to provide unique insights for being prepared for the forthcoming season.

During the 2018 proxy season, shareholders showed increasing interest in key governance matters, including director election, board effectiveness, CEO pay and Environmental Social Governance (ESG) practices. Transparency emerged as a consistent concern.

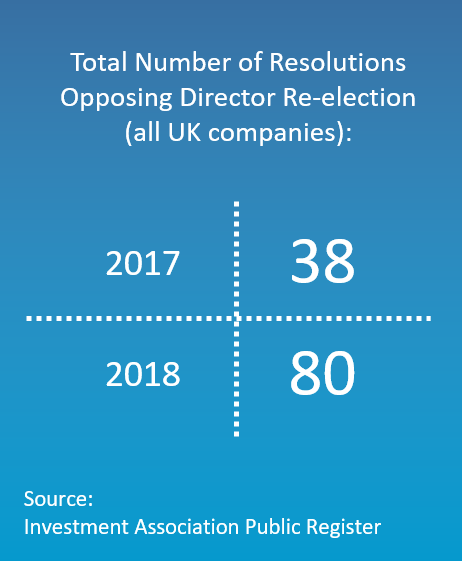
We saw unprecedented dissent from investors on director re-elections. The number of resolutions opposing individual director re-elections rose from 38 in 2017 to 80 in 2018. The reason for the increase was due to a general concern about directors becoming ‘overboarded’ and unable to fulfil their duties. Investors were also looking closely if boards possessed the right composition including skills, diversity, and gender to support long-term growth plans.

2018 Proxy Season Highlights

Say on Pay

The GCLytics report explained that CEO pay is a real concern among investors who repeatedly voted down remuneration reports and questioned short-term remuneration plans.

Pay and performance

During the year, shareholders strongly urged companies to bring pay in line with performance and voted strongly against remuneration-related resolutions if it was seen as misaligned.

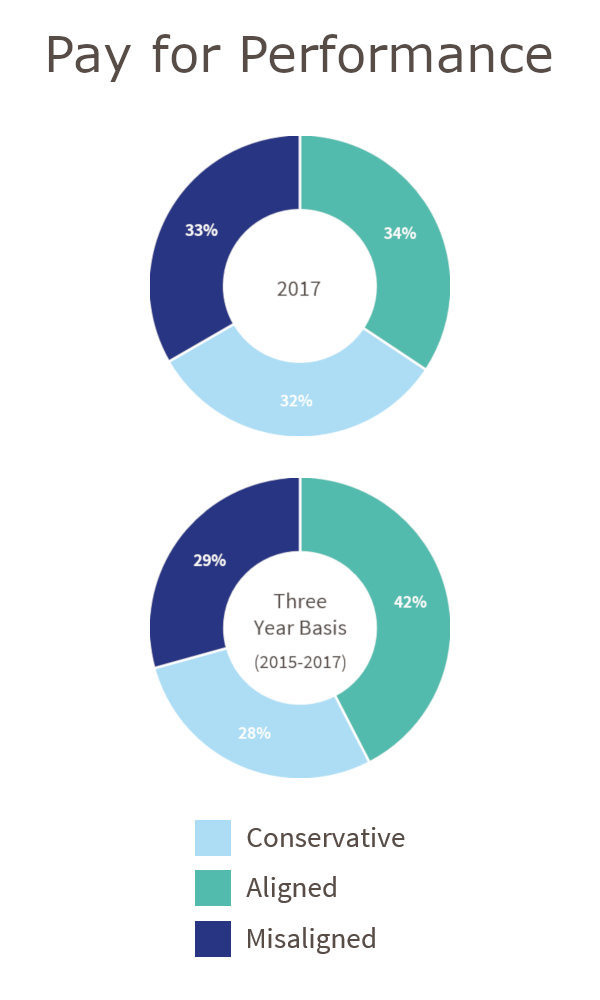
33% of companies have a pay for performance misalignment

The FTSE 100 CEO compensation landscape is evolving, with a growing emphasis on long-term incentives. However, the CGLytics study conducted on pay for performance alignment shows a material misalignment between pay and performance within many FTSE 100 companies during 2017:

  • 33% of companies have a pay for performance misalignment
  • 34% of companies display a strong alignment
  • 32% of the companies show a conservative pay practice for the performance generated, compared to other FTSE 100 companies.


With the 2019 proxy season fast approaching, boards need to be fully prepared to engage with shareholders. Having the same information as proxy advisors and investors is fundamental to proxy season readiness and good governance decision-making.

CGLytics provides real-time governance risk analytics and solutions that provide actionable insight for companies, shareholders and proxy advisors. We empower boards of companies and investors with data analytics that enables good governance.

In preparation for the 2019 proxy season, CGLytics released its third annual FTSE 100 Proxy Season report. This series of articles summarise some of the key findings. Access the full insights and statistics by downloading the report.

Aniel Mahabier

CGLytics

Latest Industry News, Views & Information

How the SEC’s new proxy voting rules will impact executive compensation

There are many software applications and tools now available to support compensation decisions, but what should be taken into consideration before purchasing? This 5-minute guide details what Compensation Committees, Heads of Reward and Compensation Professionals should take into account when selecting software and tools for Say-on-Pay decisions.

S&P 500 Banking Industry’s Response to COVID-19

CGLytics examines how S&P 500 banks responded to the volatility of the pandemic prior to the Fed’s announcement to cap bank dividends and prohibit share repurchases until Q4 following its annual stress test of banks.

How to independently and efficiently benchmark executive compensation for Say-on-Pay

There are many software applications and tools now available to support compensation decisions, but what should be taken into consideration before purchasing? This 5-minute guide details what Compensation Committees, Heads of Reward and Compensation Professionals should take into account when selecting software and tools for Say-on-Pay decisions.