Understanding ESG & Annual Incentive Plan
ESG refers to a series of environmental, social and governance criteria taken into consideration by the funds during the investing process. Investing in ESG funds allows shareholders to support companies in transition, that wish to act and develop in a more sustainable and responsible manner.
In practice, many indicators are analyzed to determine whether a fund and a company in which shareholders invests meet ESG criteria. The strategic importance of ESG issues can vary greatly depending on the company in question and its sector of activity. A company active in mining, for example, will be more exposed to ESG issues than a company in the service sector. But in any case, investing in ESG means investing in companies with good environmental, social and governance practices. As Larry Fink stated earlier this year, “the evidence on climate risk is compelling investors to reassess core assumptions about modern finance”. And in that same momentum, large companies have also started reassessing how to link performance to the remuneration of their executives using lucid, relevant ESG metrics.
Using their strong set of governance data, CGLytics’ has built an in-depth analysis of how different sectors are behaving regarding consideration of ESG metrics in their remuneration plans, for six markets: France, Germany, Switzerland, UK, the Netherlands and Sweden. The following chart shows the number of ESG KPIs incorporated by industry; all previous countries taken together.
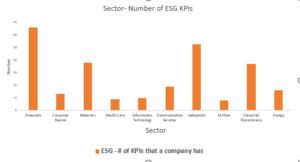
The three top performing industries in terms of ESG incorporation in remuneration plans are Financials (66 KPIs), Industrials (53 KPIs) and Materials (38 KPIs) whereas the three main laggards are Utilities (8 KPIs), Health Care (9 KPIs) and Information Technology (10 KPIs). Scrutinizing Financials and the 66 KPIs found; the data suggests that although this industry is performing the best compared to the others in terms of number of ESG KPIs, the chart below shows that only a small percentage of companies within the industry uses ESG in their remuneration plans:
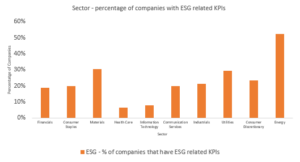
The same applies to the Industrials sector, for which only 21% (of the 69 companies in scope) have incorporated ESG metrics in their plans. On the other hand, Utilities and Energy who were both considered laggards in absolute number of KPIs, show that the sectors are more widely involved in the incorporation of ESG metrics within executive pay plans with respectively 29% and 52% of companies using ESG KPIs. Attention can be brought to the fact that among the top performers are industries for which ESG concerns derive directly from the nature of their activities.
A breakdown by country allows to see how companies behave geographically, in the universe selected for the analysis:
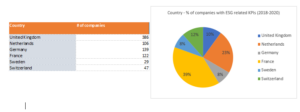
France appears to be the leader when it comes to implementing ESG metrics in executive pay models, with 51% (or 62 companies) using these metrics. In percentage, France is followed by the Netherlands with a 30% (or 32 companies) of the 106 companies in the market following the ESG trends on remuneration. At the third place in this ranking comes Switzerland, which has 15% of its 47 companies using ESG KPIs. In number of companies, the United Kingdom is however doing quite well with a 13% of the 386 companies we used for the sake of the analysis in our universe, which sums it all up to 50 companies.
The total number of ESG KPIs used in each country appears to be in line with the previous trends for France and the Netherlands showing the highest numbers once again. However, the United Kingdom is disclosing a disproportional amount of ESG KPIs with 84, almost at the level of France with 91 found metrics.
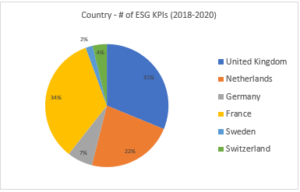
Sweden, with its relatively small total scope of 30 companies, will not be considered a laggard despite its low ranking in ESG KPIs captured and the 10% of ESG-oriented companies. Germany however, with a total scope of 139 companies, tends to manifest a certain delay in its ability to follow this global trend. Not more than 18 KPIs were found and only 10% of companies of the German market has so far linked the remuneration of their executive directors to ESG metrics.
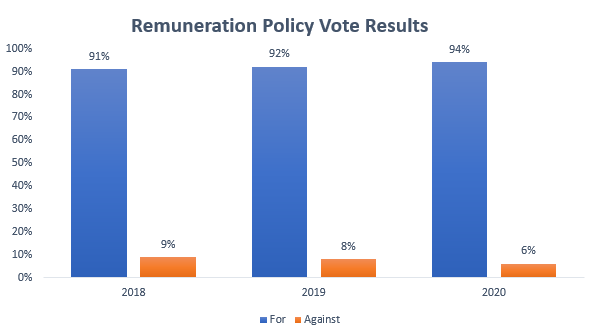
As interesting as it may be to look at country breakdowns of the situation of remuneration plans around Europe, the data points out that the evolution is improving each year. This trend is confirmed by the remuneration policy data gathered by the Research Department at CGLytics, disclosed in the following table:
![]()
The numbers are evolving in the right direction and play as a solid proof of how real and immediate the ESG concerns are to the markets.
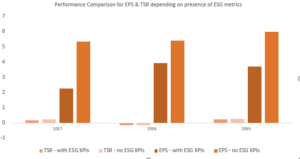
The performance comparison over three years of all companies of the six countries of your analysis disclose that both TSR and EPS are showing smaller results when remuneration is linked to ESG KPIs. Even though ESG performance goals are known to drive performance up, the conclusion we draw through our analysis does not lead to the same results. Indeed, the EPS and TSR scores of the chart below seem to decrease with the inclusion of ESG metrics within remuneration plans. Since driving performance through ESG performance indicators is new to the markets, it is possible to assume that there is still improvement to make to structure these plans in the most effective way.
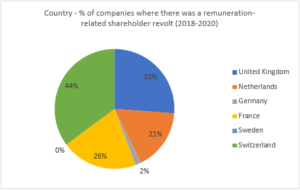
The messages sent by shareholders through their votes during General Meetings is also not to be undermined. Voting is one of the means for shareholders to express their opinions and exercise their shareholder rights/duties. The following chart shows the percentage of companies in which a shareholder revolt (> 10% votes against) happened regarding the adoption of the remuneration report, or any form of remuneration policy.
This chart demonstrates that moving towards ESG standards in remuneration policies has not been easy everywhere. Over the last three years, no less than 44% of the Swiss companies in our scope have witnessed a shareholder revolt, followed by the UK (33%) and France (26%). This represents quite well how diverging the opinions can be within Board of Directors in terms of remuneration strategy. The priorities that ESG concerns bring with them are yet to convince everyone, with an open door to mistakes in compensation models. For Germany and Sweden, the revolt rate is quite low, just like the previous results of ESG KPIs inclusion. It is important to keep in mind that some companies do not disclose extensively about their remuneration metrics and therefore will not show accurate reflection in our analysis.

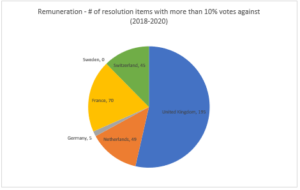
This last chart, disclosing the number of resolutions receiving shareholder revolt by country, shows that the UK and Switzerland are in two different situations. In the UK it seems that despite the greater number of companies in scope, there are still proportionally more remuneration-oriented resolutions receiving more than 10% opposing votes.
The results of our analysis allow you to obtain a good idea of where the markets are currently standing and how the trend evolves and is evolving. Besides that, every year companies are making progress in their disclosure quality and begin to understand how it benefits the market.


