Diversity on the Board? Metrics Used by Fortune 100 Companies
06.29.2020
This article examines the diversity of Fortune 100 companies’ boards, and questions the current metrics used to disclose diversity of board members. Due to the lack of uniformity of diversity disclosures, is the picture painted by some companies comprehensive enough to truly show diversity on their board?
The topic of diversity has grown in importance over the past decade. Large companies are spending time and resources discovering how having a diverse board of directors is affecting their company’s image, perception, and profits. Many companies focus on appointing employees with different education, experience, race, and backgrounds. This is illustrated through companies’ diversity statements. For example, Amazon.com, Inc. in their 2019 Proxy states,
“We take seriously our commitment to diversity and respect for people from all backgrounds, including gender, race, ethnicity, religion, sexual orientation, disability, and other dimensions of diversity, which are enduring values for us as reflected in a number of Company policies, including the Amazon Global Human Rights Principles.”[1]
Even with inclusive diversity statements, such as Amazon.com, Inc.’s, when calculating how diverse companies’ boards are, two main diversity metrics are used: gender and race. While acknowledging the positive effects of having a diverse board and showing how diversity is being valued in a company is important, examining how transparent companies are with their diversity metrics shines light on a company’s commitment to diversity.
Why is Board Diversity Beneficial for Companies?
The decisions that the board of directors make for corporations are critical for their success. The board impacts how the company is run by making crucial decisions on executive pay, dividend policies, setting yearly goals, and conducting any other business that concerns shareholders. Having a board composed of people with different backgrounds and experience will enrich conversations and allow the board to approach problems with new perspectives and ideas.[2]
Companies should actively try to understand and represent their clients and customers. In doing so, better marketing decisions and tactics can be set. For example, “Having a diverse board can help you better understand purchasing and usage decisions, particularly as studies have found that women drive 70-80 percent of purchasing in the United States.”[2]
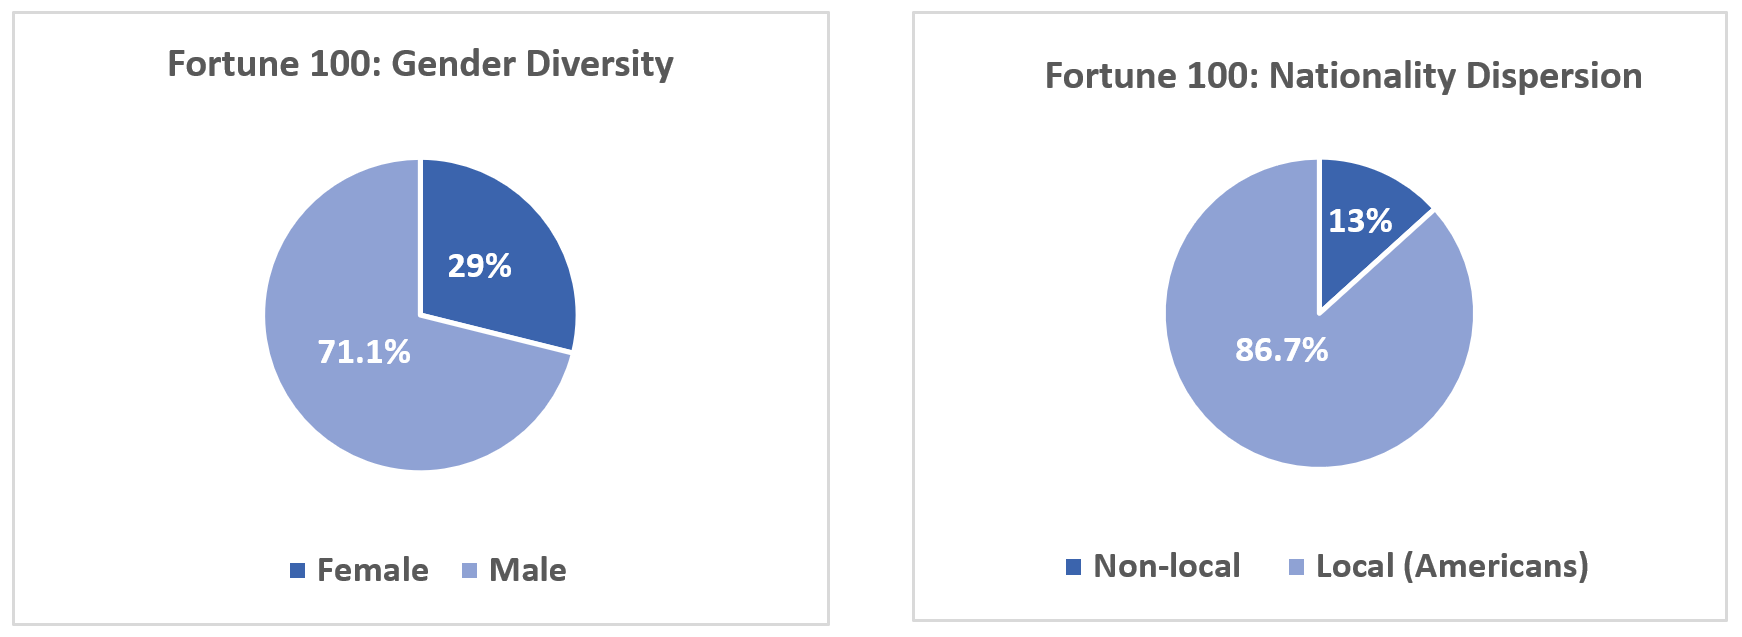
CGLytics data of board diversity reveals the percentage of gender diversity and nationality dispersion on boards of Fortune 100 companies.
As depicted in the following graphs, Fortune 100 company boards are composed of mostly American men. Unfortunately, we can not determine percentages of race within these companies because very few companies disclose information on race/ethnicity. The missing data and the lack of transparency from these companies questions their commitment to diversity.

Source: CGLytics Data and Analytics
Reporting Diversity
Based on the Fortune 100 companies’ 2018 and 2019 proxy statements, 23% of the Fortune 100 companies do not report information on diversity and the other 77% report the information using different metrics.
The reporting companies focus on gender alone, combine gender and race/ethnicity, or on nationality. There is no uniformity between companies or industries. While most companies have statements in their proxies outlining the value of diversity and how they define it, the statements are not always represented in the graphs or numbers that break down their board diversity.
This is clearly shown in Caterpillar Inc.’s 2019 Proxy statement. The company lists one of their key characteristics of their board as being diverse of “race, ethnicity, gender, cultural background or professional experience.”[3] This diversity statement implies that the board would be diverse. But it is unclear if it is as they combine gender and race in their data. In their governance highlights, Caterpillar Inc. lists their board as 45% diverse (gender and race combined).[3] By combining the percentage of gender and race, and not providing a breakdown of the directors’ backgrounds, it is difficult to determine if the board is diverse in race, ethnicity and gender.
Lack of uniformity when reporting diversity
When examining Fortune 100 companies for diversity, we find that it is difficult to compare companies’ information due to the lack of uniformity of how they are reporting data on board diversity.
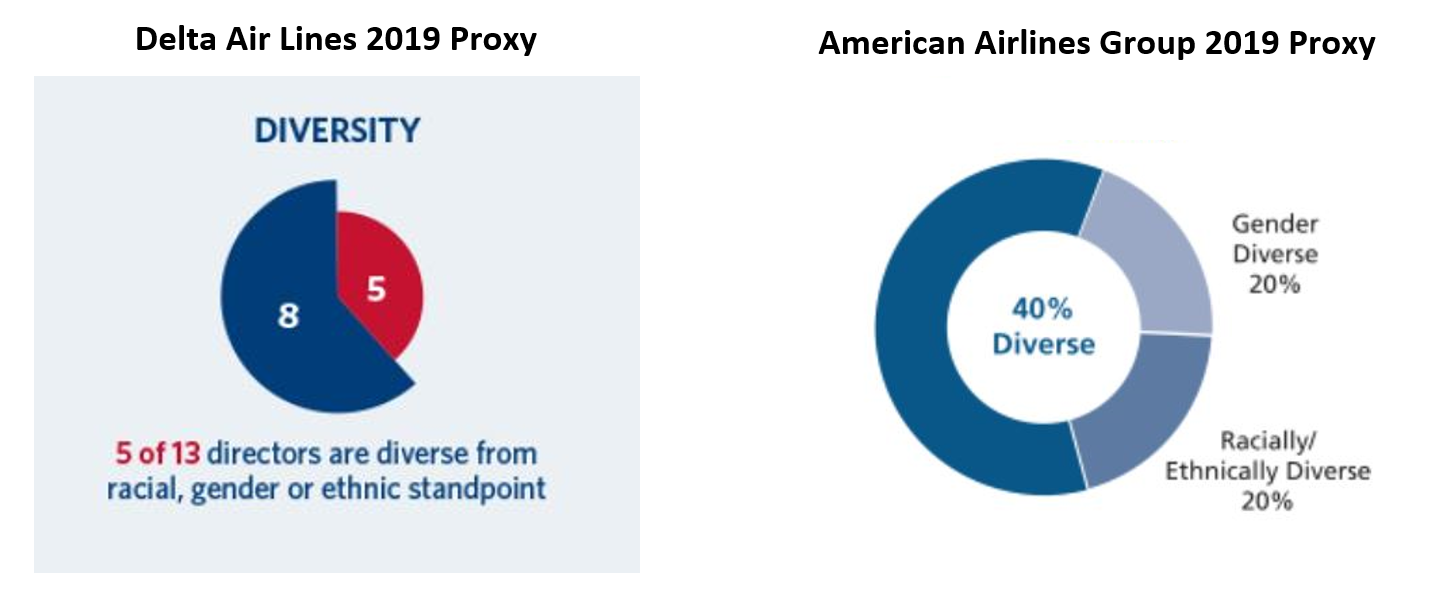
For example, Delta Air Lines, Inc. and American Airlines Group Inc., both in the same industry, report their diversity metrics differently. At first glance, both companies report roughly equal percentages of diversity (38.5% and 40% respectively). However, American Airlines Group Inc. displays their information by separating gender and race/ethnicity.

Source: Company disclosures found in the CGLytics software platform
Why would a company combine race/ethnicity and gender in their diversity graphs? One reason could be to increase the appearance of a diverse board.
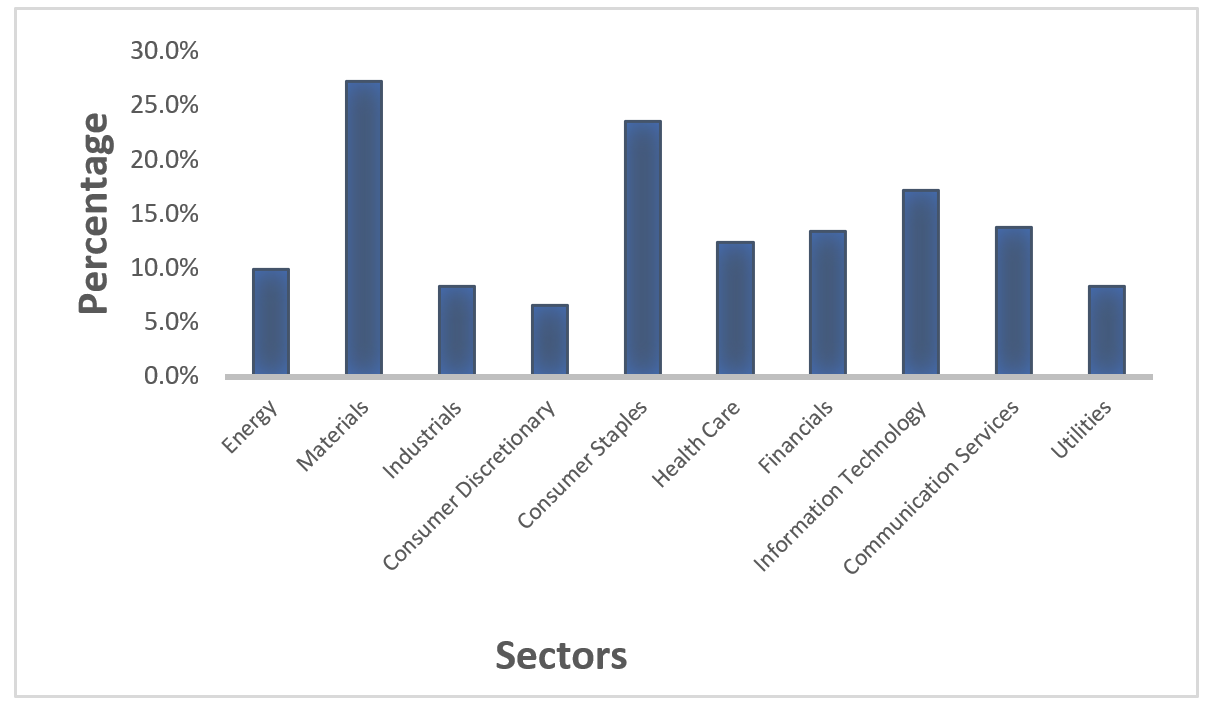
Hypothetically, if Delta Airlines, Inc.’s board consisted of four white women and one non-white male and mirrored the American Airlines Group, Inc.’s diversity chart, it would show 38.5% diversity with 7% racially/ethnically diverse and 30.7% gender diverse. While the 30.7% gender diversity would be high for their industry (as shown in the follow graph), the racial/ethnically diversity would be low. This example could be switched with gender diversity being low and would highlight a similar problem. However, without clear diversity metrics, consumers and shareholders are left questioning Delta Airline’s commitment to diversity, which could result in a loss of business.
By combining the percentages of gender and racial diversity, Delta Air Lines is hiding who is represented on their board of directors. American Airlines Group, Inc. clearly shows their shareholders, investors, and the public that they value diversity and are prepared to make well informed decisions. What does clear diversity metrics look like?
Fortune 100: Women on boards by sector

Source: CGLytics Data and Analytics
Transparent diversity metrics should give the consumers and shareholders a comprehensive background of the members on the board. This should include race/ethnicity, gender, age, and industry experience. These metrics broaden the knowledge of the board, giving the board members the tools to make successful decisions.
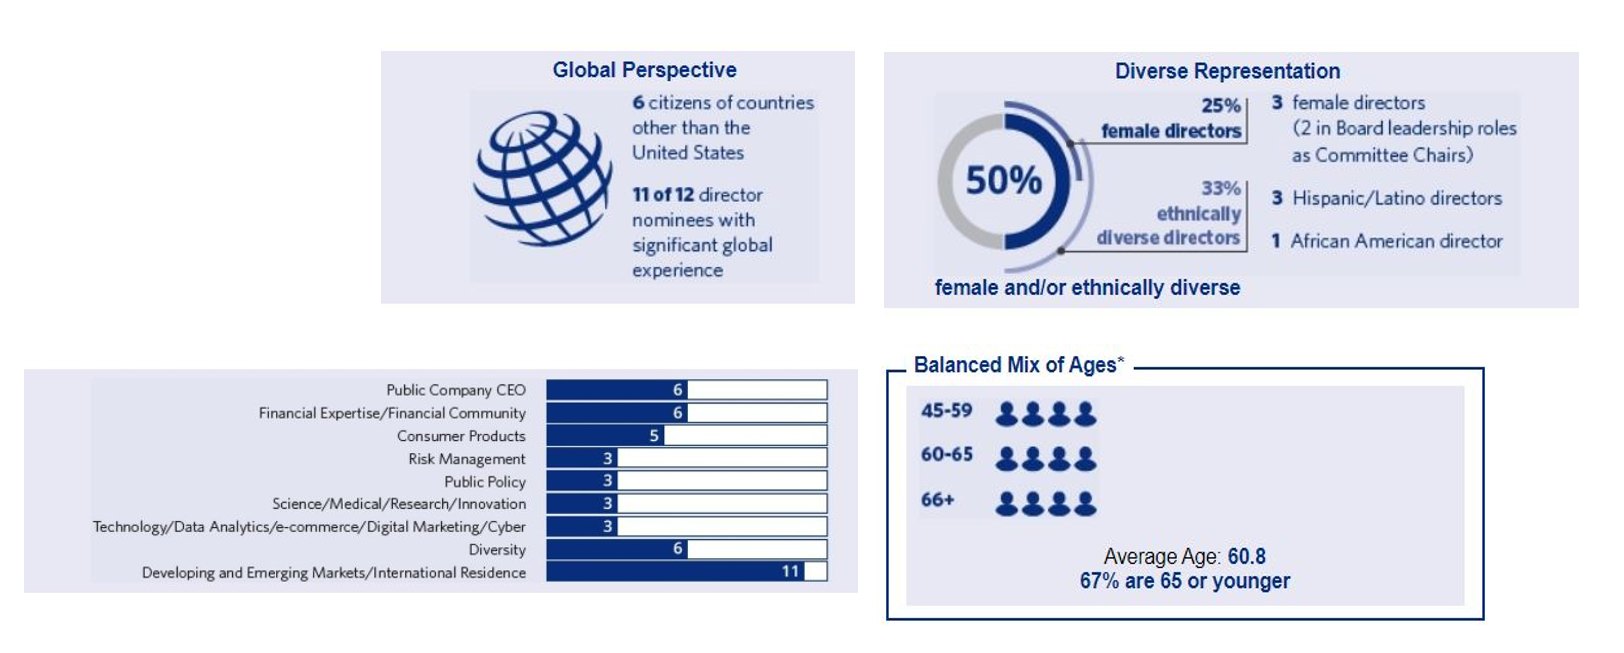
This is illustrated in PepsiCo Inc.’s 2019 proxy statement. Their diversity statement is clear and backed by their diversity percentages. It states, “Diversity including understanding the importance of diversity to a global enterprise with a diverse consumer base, informed by experience of gender, race, ethnicity and/or nationality”[4]. This is clearly shown in multiple graphs that break down backgrounds of each director.
PepsiCo Inc.’s 2019 proxy statement

Source: Company disclosures found in the CGLytics software platform
It is recommended for more companies to design their diversity statements and data like PepsiCo Inc. They shared a comprehensive view of their board and proved their board was encompassed with directors of various backgrounds. This provides consumers and shareholders with confidence that the board is well equipped to make the best decisions for the success of the company.
To gain access to Governance Intelligence and Oversight of 5,900+ globally listed companies, contact CGLytics. Within the CGLytics software platform, access 125,000+ professional executives and their skills, expertise and backgrounds for recruiting board members and building a robust, diverse board.
References
[1] https://www.sec.gov/Archives/edgar/data/1018724/000119312520108422/d897711ddef14a.htm
[2] https://www.hsph.harvard.edu/ecpe/why-diversity-matters-women-on-boards-of-directors/
[3] https://www.sec.gov/Archives/edgar/data/18230/000130817920000236/lcat2020_def14a.htm
[4] https://www.sec.gov/Archives/edgar/data/77476/000120677420000855/pep3615311-def14a.htm


