2019 CEO Pay Review: The Top 50 Highest Paid CEOs

As proxy season progresses and companies file their annual reports, CGLytics surveys the world’s highest paid CEOs (so far) and looks at how executive compensation has grown since the last year.

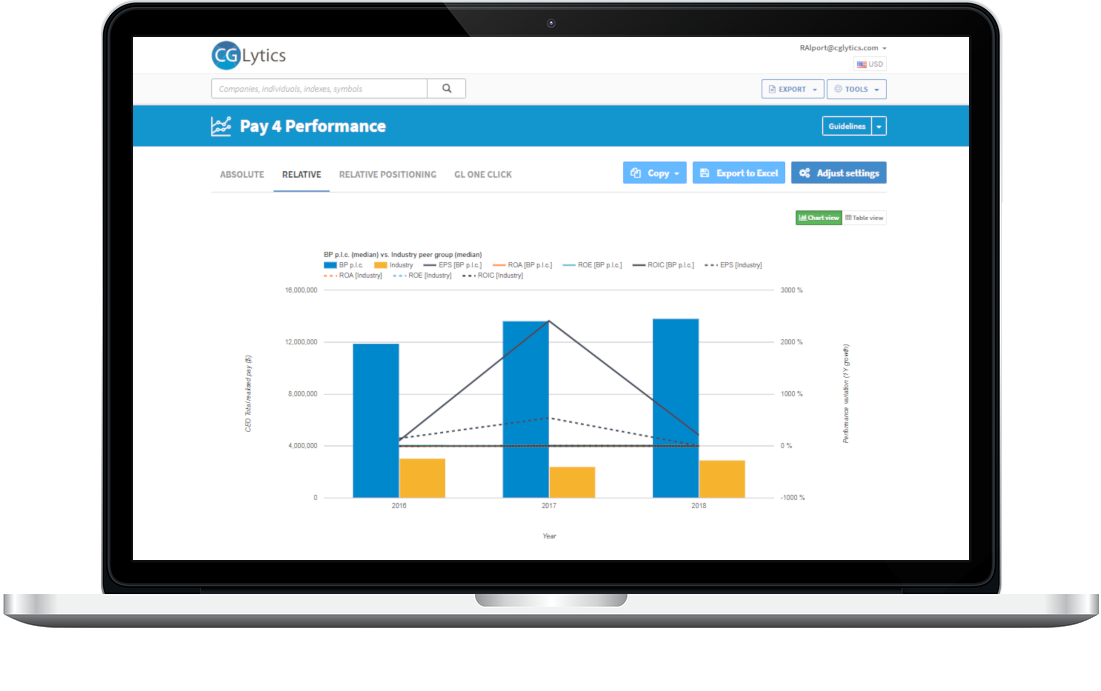
CEO Pay continued to dominate the AGM season in 2019. As we take a break over the summer, it’s worth reviewing the top 50 highest paid CEOs and seeing how this has changed from 2018.

We also take a look at how the performance of these companies has increased to understand how executives are rewarded for performance.

Key CEO pay take aways from the first half of 2019 :

  • The top 50 total granted compensation has increased by over 300% from 2018 to 2019 ($4.49bn compared to $1.12bn).
  • Although over 50% of the $4.4bn is attributable to one individual’s granted compensation (Elon Musk, Tesla: $2.28bn).
  • Even discounting this outlier, total granted executive compensation increased by 97%.
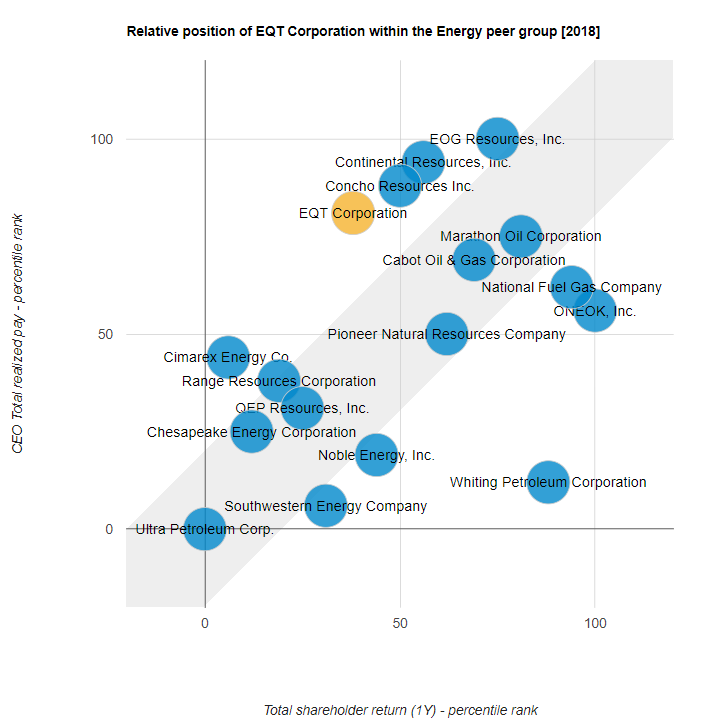
  • Meanwhile the average growth in market capitalisation was around 3% from 2018.
  • And 1 year Total Shareholder Return (TSR) actually shrank by 1%.


Given these significant increases in total granted compensation compared to the value being delivered to shareholders, it’s easy to see why CEO pay and compensation continues to dominate AGM discussions.

Trending Top 50 CEOs

Ranking

CEO

Company

Total Granted
Compensation

Total Realised Pay

TSR in %

TSR 1YR growth in
%point

1

Musk, Elon

Tesla, Inc.

$2,284,044,884
(
54575310%)

$56,380 (513%)

57%

515%

2

Smith, Patrick

Axon Enterprise, Inc.

$246,026,710
(
56433%)

$25,488,720
(
5472%)

565%

592%

3

Zaslav, David

Discovery Communications, Inc.

$129,499,005
(
5207%)

$33,498,259
(
662%)

511%

543%

4

Glancey, Stephen

C&C Group plc

$119,819,023
(
510%)

$1,643,004
(
536%)

50%

62%

5

Hodler, Bernhard

Julius Baer Group Ltd.

$78,813,367
(
54694%)

$2,979,804
(
581%)

640%

639%

6

Levine, Jay

OneMain Holdings, Inc.

$71,532,583
(
516913%)

$71,532,583
(
516913%)

67%

62%

7

Schwarzman, Stephen

The Blackstone Group L.P.

$69,147,028
(
645%)

$69,147,028
(
645%)

50%

51%

8

Legere, John

T-Mobile US, Inc.

$66,538,206
(
5270%)

$42,071,611
(
5243%)

50%

57%

9

Iger, Robert

The Walt Disney Company

$65,645,214
(
581%)

$66,065,073
(
68%)

54%

56%

10

Steele, Gary

Proofpoint, Inc.

$64,730,296
(
5892%)

$54,931,367
(
528%)

66%

510%

11

Charlès, Bernard

Dassault Systèmes SE

$51,098,970
(
577%)

$65,983,199
(
578%)

518%

517%

12

Alber, Laura

Williams-Sonoma, Inc.

$50,758,332
(
5252%)

$28,830,401
(
5224%)

51%

63%

13

Heppelmann, James

PTC Inc.

$49,969,163
(
5403%)

$17,041,464
(
5107%)

536%

546%

14

Freda, Fabrizio

The Estée Lauder Companies Inc.

$48,753,819
(
50%)

$9,387,109
(
683%)

53%

56%

15

Buckley, Henry

Uni-Select Inc.

$47,774,090
(
52687%)

$47,012,426
(
53416%)

630%

634%

16

Handler, Richard

Jefferies Financial Group Inc.

$44,674,213
(
5105%)

$5,951,709
(
5339%)

633%

638%

17

Kilroy, John

Kilroy Realty Corporation

$43,624,774
(
5282%)

$18,204,958
(
622%)

614%

610%

18

Bird, Lewis

At Home Group Inc.

$43,089,790
(
52477%)

$1,614,791
(
63%)

639%

632%

19

Lebda, Douglas

LendingTree, Inc.

$42,318,238
(
629%)

$164,584,011
(
53682%)

636%

628%

20

MacMillan, Stephen

Hologic, Inc.

$42,040,142
(
5275%)

$12,231,622
(
656%)

64%

56%

21

Hogan, Joseph

Align Technology, Inc.

$41,758,338
(
5256%)

$69,763,660
(
5504%)

66%

61%

22

Schulman, Daniel

PayPal Holdings, Inc.

$37,764,588
(
596%)

$41,295,115
(
5328%)

514%

517%

23

Hastings, Reed

Netflix, Inc.

$36,080,417
(
548%)

$4,064,854
(
698%)

539%

547%

24

Roberts, Brian

Comcast Corporation

$35,026,207
(
58%)

$47,400,117
(
640%)

613%

613%

25

Jellison, Brian

Roper Technologies, Inc.

$34,931,318
(
520%)

$142,847,568
(
5103%)

54%

59%

26

Wenig, Devin

eBay Inc.

$34,842,832
(
597%)

$19,946,164
(
566%)

626%

628%

27

Thiry, Kent

DaVita Inc.

$32,017,501
(
5109%)

$13,983,054
(
610%)

629%

632%

28

Kotick, Robert

Activision Blizzard, Inc.

$30,841,004
(
57%)

$4,307,586
(
697%)

626%

622%

29

Wichmann, David

UnitedHealth Group Incorporated

$30,824,112
(
577%)

$22,558,157
(
673%)

515%

518%

30

Dimon, James

JPMorgan Chase & Co.

$30,033,745
(
56%)

$18,136,934
(
687%)

67%

68%

31

Lutnick, Howard

BGC Partners, Inc.

$29,694,152
(
589%)

$17,791,850
(
511%)

643%

659%

32

Stephenson, Randall

AT&T Inc.

$29,118,118
(
51%)

$21,606,548
(
614%)

622%

69%

33

Narayen, Shantanu

Adobe Systems Incorporated

$28,397,528
(
529%)

$67,297,455
(
555%)

529%

534%


Benioff, Marc

salesforce.com, inc.

$28,391,846
(
5510%)

$44,183,075
(
662%)

534%

549%

35

Moghadam, Hamid

Prologis, Inc.

$28,201,397
(
546%)

$35,887,540
(
56%)

66%

516%

36

Gorman, James

Morgan Stanley

$28,168,639
(
515%)

$19,299,856
(
652%)

623%

624%

37

Florance, Andrew

CoStar Group, Inc.

$27,555,954
(
5159%)

$18,644,383
(
517%)

514%

520%

38

Greenberg, Robert

Skechers U.S.A., Inc.

$27,361,406
(
5252%)

$11,157,656
(
515%)

640%

637%

39

Umpleby, D.

Caterpillar Inc.

$27,289,513
(
594%)

$14,840,544
(
5171%)

618%

616%

40

Fink, Laurence

BlackRock, Inc.

$26,543,344
(
64%)

$51,471,260
(
561%)

622%

621%

41

Schleifer, Leonard

Regeneron Pharmaceuticals, Inc.

$26,520,555
(
50%)

$117,840,017
(
524%)

61%

56%

42

Chenault, Kenneth

American Express Company

$24,208,661
(
530%)

$54,431,474
(
642%)

63%

61%

43

Holmes, Stephen

Wyndham Worldwide Corporation

$21,479,166
(
542%)

$50,161,004
(
553%)

629%

669%

44

Johnson, R.

HCA Healthcare, Inc.

$21,419,906
(
524%)

$109,050,692
(
51407%)

543%

544%

45

Banga, Ajaypal

MasterCard Incorporated

$20,379,353
(
59%)

$60,704,447
(
5145%)

525%

528%

46

Brown, Gregory

Motorola Solutions, Inc.

$20,348,558
(
533%)

$69,555,180
(
5137%)

530%

535%

47

Minogue, Michael

ABIOMED, Inc.

$19,243,230
(
587%)

$123,043,867
(
5907%)

573%

585%

48

Casper, Marc

Thermo Fisher Scientific Inc.

$18,607,103
(
616%)

$85,476,755
(
5161%)

518%

524%

49

Meyer, James

Sirius XM Holdings Inc.

$17,633,953
(
582%)

$50,452,233
(
5331%)

57%

56%

50

Fairbank, Richard

Capital One Financial Corporation

$17,333,796
(
57%)

$108,527,637
(
557%)

623%

622%

[1] Compensation in USD – exchange rates based on single point of time, end of tax year 2018.

[2] Excludes executives appointed since 2017 season.

Want to know the impact COVID-19 has had on executive compensation?

Download our latest whitepaper to learn how you can address a range of governance, design and administration challenges that involve executive and non-employee director compensation programs.

Latest Industry News, Views & Information

How the SEC’s new proxy voting rules will impact executive compensation

There are many software applications and tools now available to support compensation decisions, but what should be taken into consideration before purchasing? This 5-minute guide details what Compensation Committees, Heads of Reward and Compensation Professionals should take into account when selecting software and tools for Say-on-Pay decisions.

S&P 500 Banking Industry’s Response to COVID-19

CGLytics examines how S&P 500 banks responded to the volatility of the pandemic prior to the Fed’s announcement to cap bank dividends and prohibit share repurchases until Q4 following its annual stress test of banks.

How to independently and efficiently benchmark executive compensation for Say-on-Pay

There are many software applications and tools now available to support compensation decisions, but what should be taken into consideration before purchasing? This 5-minute guide details what Compensation Committees, Heads of Reward and Compensation Professionals should take into account when selecting software and tools for Say-on-Pay decisions.

Data puts CEO rewards into perspective in the Netherlands

In this article, originally published in Dutch in Mgmt. Scope, CGLytics examines CEO pay in the Netherlands and how it is one of the hottest topics in shareholder discussions.

This article on CEO pay in the Netherlands first appeared in Dutch in Mgmt. Scope on 27th May 2019: https://managementscope.nl/online/data-zet-beloning-ceo-in-perspectief

Shareholders are making themselves heard more than ever about the strategy of the company. Certainly the remuneration of directors has gained much attention. Corporate governance analytics – the specialization of CGLytics – helps to separate the facts from the opinions in regards to remuneration policies. This is also not a superfluous luxury: data shows that shareholders are quite rightly concerned.

In recent years, shareholders have been expressing themselves more and more emphatically at General Meetings of Shareholders (AGMs). In 2018, the average number of votes cast at the AGMs of AEX companies reached a record level of 72.4 percent. Never before have shareholders voted so massively on the issues that concern them. The most important topic from a distance: the remuneration of directors. The figures for 2019 are not yet complete, but the same picture emerges.

Remuneration of directors

What does the data say? The remuneration policy, and certainly the alignment of the CEO’s remuneration, keeps the minds of shareholders busy. The average percentage of votes against the remuneration policy of all Dutch listed companies rose to 16.5 percent in 2018. That is more than double the average for the combined years of 2015, 2016 and 2017. The media is also paying more and more attention to the remuneration policy of companies. These are important reasons to take any adjustments to the remuneration policy very seriously. Paying attention to remuneration fits in with the development of corporate social responsibility (ESG practices). Companies must be able to indicate how the remuneration of the CEO contributes to long-term value creation. They must also be willing to discuss their performance in this area. For example, in the amended corporate governance code, the disclosure of the relationship between the remuneration of CEOs and the average employee is already mandatory. The legislation is expected to follow soon.

Pay for performance

An important indicator for value creation in the long term is pay for performance, or the ratio between remuneration and performance. There is still a lot for companies to do in this area. Data from CGLytics shows that the financial performance of companies and the rewards of their CEOs are poorly aligned. 44 percent of the 25 AEX companies – measured over the 2017 financial year – have an imbalance between remuneration and performance. Which means the CEO’s remuneration is higher than expected based on the company’s performance. Over a three-year period, 2015-2017, this is 38 percent. There is also good news. Over the past five years, AEX companies have found a better mix between fixed, short-term and long-term bonuses in their remuneration policy for directors. The average basic salary and the long-term bonuses increased, while the size of the short-term bonuses decreased. It is generally accepted that a fixed compensation and long-term bonuses do more for long-term value creation for stakeholders.

Data provides insight

Data therefore offers important insights; not just for shareholders. It is not for nothing that an increasing number of directors, supervisors, remuneration committees and investors use corporate governance data to test the remuneration policy. Data helps determine an adequate remuneration structure and makes it possible to distinguish the facts from the opinions.

Latest Industry News, Views & Information

Understanding ESG & Annual Incentive Plan

Understanding ESG & Annual Incentive Plan ESG refers to a series of environmental, social and governance criteria taken into consideration by the funds during the investing process. Investing in ESG funds allows shareholders to support companies in transition, that wish to act and develop in a more sustainable and responsible manner. In practice, many indicators … Continue reading “Understanding ESG & Annual Incentive Plan”

Pay for Performance: The Largest Institutional Investors’ View

Pay for Performance: The Largest Institutional Investors’ View   Executive compensation has been one of the trickiest issues within the corporate governance space as of late. Across the board, there seems to be no end in sight to finding the perfect compensation package or philosophy for corporate executives. In this article, we will discuss the … Continue reading “Pay for Performance: The Largest Institutional Investors’ View”

How to design your peer group for compensation benchmarking

How to design your peer group for compensation benchmarking   Given the scrutiny on executive compensation in recent years, it is critical to make sure that your company’s executive pay reflects its performance and aligns with the market. Therefore, it is essential for companies to have an appropriate peer group for performance benchmarking, compensation program … Continue reading "How to design your peer group for compensation benchmarking"

In the spotlight: EQT Corporation Proxy Statement

In this article, CGLytics takes a look at the upcoming EQT Corporation AGM resolutions and how the CGLytics platform analytics can help promote engagement between the company and shareholders.

EQT Corporation AGM

As proxy season in the United States is winding down, only a handful of companies are still left to host their Annual General Meeting (AGM).  EQT Corporation, the largest natural-gas producer in the US, will host its AGM on July 10 and has subsequently invited its shareholders to attend and vote on four resolutions. Namely:

  1. The election to the Company’s Board of Directors of the 12 directors nominated by the Board to serve for one-year terms
  2. The approval of a non-binding resolution regarding the compensation of the Company’s named executive officers for 2018
  3. The approval of the EQT Corporation 2019 Long-Term Incentive Plan
  4. The ratification of Ernst & Young LLP as the Company’s independent registered public accounting firm for 2019

Contested Election

With twelve incumbent management nominees, “Rice Group” has also put forward six nominees for election utilizing the universal proxy card, which the board adopted in 2019. Toby Rice, partner of Rice Investment Group, elaborated on individual nominations by saying “We believe a comprehensive solution is required to effect the fundamental course correction needed to deliver full value to shareholders”. In response the leadership team at EQT has urged voters to disregard the plea from the Rice Group by arguing that the nominations would “immediately jeopardize the value of [the] investment by installing their friends”.

CGLytics’ Board expertise analytics shows that, given the current board’s composition, the board currently lacks expertise in the following sectors: Technology, Financial, Governance, International, and Industry/Sector.

Source: CGLytics Data and Analytics

EQT Corporation proposes the election of the following three individuals: Janet L. Carrig, James T. McManus and Valera A. Mitchell.  If elected, the areas of expertise the three nominees would bring to EQT’s Board would be Governance, Executive, Non-Executive, Leadership and International. This also means that post-election of these director nominees, the board would remain unbalanced in regard to Technology and Financial Expertise. However, when reviewing the background of just three of the six nominees from the Rice Group, Lydia I. Beebe, Lee M. Canaan and Kathryn J. Jackson, their aggregate expertise is comprised of Non-Executive, Executive, Leadership, and most notably, Governance, Financial expertise and Technology.

CGLytics does not advocate for or against the election of any of the individuals, however governance matters should entail a certain level of scrutiny. The data analytics available on the CGLytics platform provides for a new and unparalleled insight into governance issues which helps place agency back in the hands of the shareholder and helps companies to better understand their practice against market norms.

Executive Compensation

Earlier in 2018, EQT underwent several key management changes including the appointment of a new CEO and CFO. In March 2018 Steven Schlotterbeck stepped down as CEO for personal reasons and was succeeded by interim CEO David Porges. In November in the same year Robert McNally, previously CFO, was appointed as CEO and Jimmi Sue Smith took over as CFO. Several board members were also appointed to replace departing directors.

Item 2 on the agenda dictates a vote on the approval of the compensation of the company’s named executive officers. When reviewing the CEO’s compensation proposal with CGLytics’ executive compensation and pay for performance modeler, we find a potential misalignment between CEO remuneration and one-year total shareholder return.

CGLytics’ data and analytics are trusted and used worldwide by Glass Lewis, the leading independent proxy advisor, as a basis for their research on companies.

Like most U.S. corporations, EQT Corporations proxy statement describes their compensation packages as “weighted in favor of performance-based, at-risk compensation through annual and long-term performance-based incentive programs”. Delving further into the pay-structure of the CEO, this philosophy seems to hold true as most of the remuneration is derived from Long term and short-term incentives (LTIs and STIs). Stock awards account for the majority of the LTIs for the CEO where the largest contributor in dollar amount is the Incentive PSU program, with TSR being the highest weighted performance criterion. In particular, considering EQT’s emphasis on TSR, it is important to note the long-term diverging trend between the company’s one-year TSR and CEO remuneration. More specifically, executive pay from 2016 and onwards has been on the rise while TSR has been declining and currently sits at its lowest point over the last 10 years.

Source: CGLytics P4P Modeler

Moreover, when comparing EQT’s CEO pay practise relative to its disclosed peer group, as disclosed in the graphs below, we see a pay for performance misalignment between TSR and compensation over both a one -year and five-year period.

Source: CGLytics P4P Modeler

Item 3 on the agenda entails the approval of the 2019 Long-Term Incentive Plan which enables the company to grant stock awards to its executive officers. The granting of these awards will be based on the achievement of certain performance measures, namely relative TSR (50% weight), operating efficiency (25% weight), and development efficiency (25% weight). Moreover, the ultimate payout under the award plan is subject to a modifier based on achieved ROCE, which could push executives’ payout as high as 1.1 times higher than based on achievement of the three preceding performance criteria alone.

CGLytics offers the broadest, up to date global data set and powerful benchmarking tools to conduct comprehensive analysis for executive compensation decisions and risk oversight. CGLytics is Glass Lewis’ source for global compensation data and analytics. These analytics power Glass Lewis’ voting recommendations in both their proxy papers and their custom policy engine service.

For more information regarding how CGLytics’ deep, global data set and unparalleled analytical screening tools can potentially help you make better decisions, click here.

Sources:

CGLYTICS DATA AND ANALYTICS   EQT 2019 PROXY STATEMENT

About the Author

Jaco Fourie: U.S. Research Analyst

Jaco holds a Bachelor of Science degree in Accounting and Finance from the University of Reading. He has gained experience as a research analyst from his enrollment at the Henley Business School and the International Capital Market Association Centre.

Latest Industry News, Views & Information

Understanding ESG & Annual Incentive Plan

Understanding ESG & Annual Incentive Plan ESG refers to a series of environmental, social and governance criteria taken into consideration by the funds during the investing process. Investing in ESG funds allows shareholders to support companies in transition, that wish to act and develop in a more sustainable and responsible manner. In practice, many indicators … Continue reading “Understanding ESG & Annual Incentive Plan”

Pay for Performance: The Largest Institutional Investors’ View

Pay for Performance: The Largest Institutional Investors’ View   Executive compensation has been one of the trickiest issues within the corporate governance space as of late. Across the board, there seems to be no end in sight to finding the perfect compensation package or philosophy for corporate executives. In this article, we will discuss the … Continue reading “Pay for Performance: The Largest Institutional Investors’ View”

How to design your peer group for compensation benchmarking

How to design your peer group for compensation benchmarking   Given the scrutiny on executive compensation in recent years, it is critical to make sure that your company’s executive pay reflects its performance and aligns with the market. Therefore, it is essential for companies to have an appropriate peer group for performance benchmarking, compensation program … Continue reading "How to design your peer group for compensation benchmarking"

Growing Expectations of Director Responsibilities and Evolving Attitudes Towards Overboarding

CGLytics takes a look at how the role of the board is changing, and how directors are having to rapidly become experts in a range of topics in which they have little to no previous experience.

Overboarding has been recognised as a potential governance issue for some time, with questions over the ability of directors to discharge their duties effectively if they are over-committed to more responsibilities than they have the capacity to manage. As scrutiny increases, this issue has become a greater focus for investors as directors face an ever-increasing set of new responsibilities for which they are expected to provide oversight.

Historically, the responsibilities of board members included participation in regularly scheduled management strategy reviews, often followed by robust debate of such strategy, reviewing of financial statements, assessments of enterprise and industry-specific risks, facing the companies at which they serve, as well as legal compliance issues. However, new threats from a variety of vectors are requiring directors to rapidly become experts in a range of topics in which they have little to no previous experience. Among these new areas of potential risk that boards are increasingly expected to address, we find the most pertinent topics to be:

  1. cybersecurity risks,
  2. the impact of disruptive technologies,
  3. board members’ increasing role in investor relations,
  4. competitive intelligence, and
  5. international business experience.

The ensemble of these new responsibilities requires corporate boards to assess the skills set requisite for its own composition in order to remain competitive in an increasingly fierce global environment. The expectations of this type of board accountability, known as “supergovernance”, assumes that board members are capable of peering around every corner in order to counter all possible threats to their company.

Balancing Act 

While investor-specific policies towards the maximum number of public boards on which a director should serve are not new, increasing responsibilities for board members are leading investors to re-evaluate their previous thresholds of overboarding. Most prominently, Vanguard, the world’s second largest asset manager, has recently publicly disclosed that its voting policy stipulates to vote against an executive director (defined as a Named Executive Officer who serves on the board at which they hold the role of executive) at any outside board at which they serve. Moreover, their updated overboarding voting policy also states that they will vote against any non-executive director who sits on more than four boards in total at all boards on which they serve.

Blackrock has taken a similar position in its 2019 U.S. voting policy, allowing non-CEO directors to hold a maximum of four directorships in total at public companies. However, Blackrock will still allow a public company CEO to serve on a total of two public boards, and currently makes no distinction in the U.S. between executive directors (other than the CEO) and non-executive directors in the total number of boards on which they may serve.

Taking Vanguard’s holdings of 4,861 companies across the U.S., Europe, Canada, Japan and Australia, the CGLytics research team performance an exercise utilizing CGLytics’ data and analytics platform to assess the potential impact of this new overboarding policy on Vanguard’s proxy voting activities. We find that, globally, the implementation of Vanguard’s new guidelines would potentially lead to fairly high levels of opposition, upwards of 23%, for NEO director nominees, who sit on boards outside of the company at which they currently serve as an executive.

Source: CGLytics Data and Analytics

An examination of the current composition of Vanguard’s top 25 holdings also reveals that the implementation of their new guidelines will have an even sharper increase in potential votes against NEOs due to overboarding than during the hypothetical exercise across the full universe of Vanguard’s holdings.

Source: CGLytics Data and Analytics

Not Such a Hard Line

While such an approach may appear rather restrictive for corporate directors and many institutional investors alike, some investors mitigate the perceived severity of this approach by indicating that they will evaluate director appointees who fall outside their overboarding thresholds on a case-by-case basis. Moreover, the language included in their voting policies also makes certain exceptions should the director nominee indicate that she/he will step down from one of the outside boards on which he/she serves within a certain period after their election. Investor engagement also provides corporate directors some leeway, as the issuer-investor dialogue may allow one-off exceptions from opposition to a potentially overboarded director’s election based on the outcome of the engagement.

Finally, the question is raised as to whether these lowered thresholds might benefit corporate board members? Long gone are the days when the expectations for the role of corporate director would be to approve management’s agenda for the company, with cursory corporate oversight capacity. Due to the increasing pressure that board members face in their oversight duties, reducing the number of acceptable directorships from the investor community might provide some breathing room for directors to fully engage in their responsibilities as director. This extra breathing room could potentially allow them to better educate themselves about emerging threats facing the companies on which they serve.

Conversely, the increasing expectations and responsibilities placed on corporate boards often spring directly from the investor community itself. The growing momentum within the investor community implies and often explicitly expects directors to be fully educated on enterprise and material industry risks, as well fully focused on their responsibilities as board members in order to maximize the value of their investments.

As the balancing act between these two perspectives plays out, the issue of potential overboarding for any individual director may prove not to be black or white, but a distinction between various levels of grey. In order to help investors, corporate boards, and executive alike to distinguish between these various shades, CGLytics offers an extensive database with smart analytical tools, to easily screen for potentially overboarded directors. Being able to instantly view the board composition, and that of peers, provides insights into areas of governance practices that may pose a potential risk. In addition, CGLytics’ provides skills matrices to highlight skills and expertise strengths and shortages, director interlocks and smart relationship mapping tools to leverage networking opportunities: all in the one system.

Learn how boards use CGLytics to identify and mitigate governance red flags

Get access to the same insights as investors and proxy advisors with CGLytics’ boardroom intelligence capabilities. With easy to use comparison tools and standardised data, instantly perform a governance health check against regulatory norms and market standards.

Corporate Governance Risk Report

Latest Industry News, Views & Information

Understanding ESG & Annual Incentive Plan

Understanding ESG & Annual Incentive Plan ESG refers to a series of environmental, social and governance criteria taken into consideration by the funds during the investing process. Investing in ESG funds allows shareholders to support companies in transition, that wish to act and develop in a more sustainable and responsible manner. In practice, many indicators … Continue reading “Understanding ESG & Annual Incentive Plan”

Pay for Performance: The Largest Institutional Investors’ View

Pay for Performance: The Largest Institutional Investors’ View   Executive compensation has been one of the trickiest issues within the corporate governance space as of late. Across the board, there seems to be no end in sight to finding the perfect compensation package or philosophy for corporate executives. In this article, we will discuss the … Continue reading “Pay for Performance: The Largest Institutional Investors’ View”

How to design your peer group for compensation benchmarking

How to design your peer group for compensation benchmarking   Given the scrutiny on executive compensation in recent years, it is critical to make sure that your company’s executive pay reflects its performance and aligns with the market. Therefore, it is essential for companies to have an appropriate peer group for performance benchmarking, compensation program … Continue reading "How to design your peer group for compensation benchmarking"

The Top 50 Highest Paid CEOs

As proxy season progresses and companies file their annual reports, CGLytics surveys the world’s highest paid CEOs (so far) and looks at how executive compensation has grown since the last year.

CEO pay and compensation continues to be one of the most hotly debated topics in the 2019 Proxy Season with companies and individuals regularly under scrutiny by investors and the media.

Utilising our deep, global data set, sourced from the filings and published returns of over 5,500 publicly listed companies, CGLytics examines the top 50 highest paid CEOs across the globe to have had their 2018 Total Granted Compensation (TGC)[1] and Total Realized Pay (TRP) published in 2019.

Key findings:

  • Total Granted Compensation for the top 50 CEOs was over $1.82bn, more than the GDP of 21 National Economies.
  • Average Total Granted Compensation for 2018 was $37,030,673.71, an increase of 62% from 2017.
    Average Total Realised Pay was $37,909,498.5, an increase of 4.4% from 2017.
  • The top 5 CEOs accounted for over 27% of the total Total Granted Compensation for 2017.
  • Total Shareholder Return decreased by an average of 6% across the group, indicating that this season, Pay for Performance is going to be a contentious topic as shareholders continue to challenge misaligned compensation packages.


This research is updated on a bi-weekly basis, with the latest information taken from May 3, 2019. It will be updated to reflect the top 50 CEOs as companies publish their annual results through to the end of the 2019 Proxy Season.

Trending Top 50 CEOs


Ranking

CEO

Company

Change in rank (since 18 April)

Total Granted Compensation

Total Realised Pay

TSR in %

TSR 1YR growth in %point

1

Zaslav, David

Discovery
Communications, Inc.


 $129,499,005 (5207%)

 $33,498,259 (662%)

11%

29%

2

Hurd, Mark

Oracle Corporation


 $108,295,023 (5165%)

 $26,690,273 (583%)

63%

628%

3

Catz, Safra

Oracle Corporation


 $108,282,333 (5166%)

 $162,740,735 (520%)

63%

628%

4

Hodler, Bernhard

Julius Baer Group Ltd.


 $78,813,367 (54544%)

 $2,979,804
(576%)

640%

675%

5

Levine, Jay

OneMain Holdings, Inc.

new

 $71,532,583 (516913%)

 $71,532,583 (516913%)

67%

624%

6

Schwarzman, Stephen

The Blackstone Group L.P.

-1

 $69,147,028 (645%)

 $69,147,028 (645%)

0%

27%

7

Iger, Robert

The Walt Disney
Company

-1

 $65,645,214 (581%)

 $66,065,073 (68%)

4%

61%

8

Charlès, Bernard

Dassault Systèmes SE

new

 $51,098,970
(564%)

 $65,983,199 (564%)

18%

66%

9

Heppelmann, James

PTC Inc.

-2

 $49,969,163 (5403%)

 $17,041,464 (5107%)

36%

5%

10

Freda, Fabrizio

The Estée Lauder Companies Inc.

-2

 $48,753,819 (0%)

 $9,387,109
(683%)

3%

665%

11

Handler, Richard

Jefferies Financial
Group Inc.

-2

 $44,674,213 (5105%)

 $5,951,709 (5339%)

633%

649%

12

Kilroy, John

Kilroy Realty Corporation

new

 $43,624,774 (5282%)

 $18,204,958 (622%)

614%

618%

13

MacMillan, Stephen

Hologic, Inc.

-3

 $42,040,142 (5275%)

 $12,231,622 (656%)

64%

610%

14

Hogan, Joseph

Align Technology, Inc.

new

 $41,758,338 (5256%)

 $69,763,660 (5504%)

66%

6137%

15

Schulman, Daniel

PayPal Holdings,
Inc.

new

 $37,764,588 (596%)

 $41,295,115 (5328%)

14%

672%

16

Lawrie, John

DXC Technology Company

-5

 $32,185,309 (572%)

 $7,105,877
(676%)

635%

17

Dimon, James

JPMorgan Chase &
Co.

new

 $30,033,745 (56%)

 $18,136,934 (687%)

67%

633%

18

Stephenson, Randall

AT&T Inc.

-6

 $29,118,118 (51%)

 $21,606,548
(614%)

622%

618%

19

Narayen, Shantanu

Adobe Systems
Incorporated

-6

 $28,397,528 (529%)

 $67,297,455 (555%)

29%

641%

20

Moghadam, Hamid

Prologis, Inc.

-6

 $28,201,397 (546%)

 $35,887,540 (56%)

66%

632%

21

Greenberg, Robert

Skechers U.S.A.,
Inc.

new

 $27,361,406 (5252%)

 $11,157,656 (515%)

640%

693%

22

Garrabrants, Gregory

BofI Holding, Inc.

-7

 $26,975,924 (5299%)

 $12,708,360 (568%)

616%

621%

23

Strangfeld, John

Prudential
Financial, Inc.

-7

 $26,696,966 (62%)

 $15,525,376 (649%)

626%

640%

24

Milligan, John

Gilead Sciences Inc.

-7

 $25,961,831 (568%)

 $21,781,701 (54%)

610%

613%

25

Nadella, Satya

Microsoft
Corporation

-7

 $25,843,263 (529%)

 $34,874,210 (517%)

21%

620%

26

Nooyi, Indra

Pepsico, Inc.

-7

 $24,491,117 (621%)

 $26,276,686 (668%)

65%

623%

27

White, Miles

Abbott Laboratories

-7

 $24,254,238 (528%)

 $31,646,904 (51%)

29%

623%

28

Chenault, Kenneth

American Express Company

-7

 $24,208,661 (530%)

 $54,431,474
(642%)

63%

639%

29

Bush, Wesley

Northrop Grumman
Corporation

-7

 $24,185,259 (528%)

 $34,319,926 (51%)

619%

653%

30

Corbat, Michael

Citigroup Inc.

-7

 $24,183,714 (536%)

 $20,164,941 (534%)

628%

656%

31

Wren, John

Omnicom Group Inc.

new

 $23,945,128 (0%)

 $23,633,099 (59%)

4%

16%

32

Lance, Ryan

ConocoPhillips

-8

 $23,406,270 (57%)

 $21,852,860 (528%)

16%

4%

33

Muilenburg, Dennis

The Boeing Company

-8

 $23,392,187 (527%)

 $31,334,957 (519%)

12%

683%

34

Blankfein, Lloyd

The Goldman Sachs Group, Inc.

-8

 $23,390,658 (56%)

 $6,617,836
(677%)

634%

641%

35

Moynihan, Brian

Bank of America
Corporation

-8

 $22,754,510 (54%)

 $25,330,434 (525%)

615%

651%

36

Hewson, Marillyn

Lockheed Martin Corporation

-8

 $22,717,004 (61%)

 $34,148,718 (53%)

616%

648%

37

Miller, Alan

Universal Health
Services, Inc.

new

 $22,588,883 (54%)

 $6,324,536 (683%)

3%

64%

38

Osuna Gómez, Juan

Obrascón Huarte Lain, S.A.

new

 $22,331,445 (5755%)

 $22,331,445
(5755%)

686%

6137%

39

Tyagarajan, NV

Genpact Limited

new

 $22,299,191 (5608%)

 $1,738,855 (664%)

614%

646%

40

Nanterme, Pierre

Accenture plc

-11

 $22,299,174 (513%)

 $29,414,791 (531%)

66%

640%

41

Messina, Carlo

Intesa Sanpaolo
S.p.A.

-11

 $22,182,562 (5193%)

 $5,842,684 (523%)

625%

647%

42

Holmes, Stephen

Wyndham Worldwide Corporation

new

 $21,479,166 (542%)

 $50,161,004 (553%)

629%

684%

43

Johnson, R.

HCA Healthcare, Inc.

-12

 $21,419,906 (524%)

 $109,050,692 (51407%)

43%

25%

44

Novakovic, Phebe

General Dynamics Corporation

-12

 $20,720,254 (64%)

 $41,885,999 (513%)

621%

641%

45

Brown, Gregory

Motorola Solutions,
Inc.

-12

 $20,348,558 (533%)

 $69,555,180 (5137%)

30%

18%

46

Gorsky, Alex

Johnson & Johnson

-12

 $20,097,572 (633%)

 $46,428,340 (555%)

65%

630%

47

Read, Ian

Pfizer Inc.

-12

 $19,549,213 (630%)

 $47,042,550 (567%)

25%

9%

48

Casper, Marc

Thermo Fisher Scientific Inc.

new

 $18,607,103 (616%)

 $85,476,755 (5161%)

18%

617%

49

Allen, Samuel

Deere & Company

-13

 $18,525,667 (515%)

 $44,767,370 (5155%)

63%

658%

50

Hammergren, John

McKesson Corporation

-13

 $18,143,017 (610%)

 $63,161,402 (635%)

628%

640%

[1] Compensation in USD – exchange rates based on single point of time, end of tax year 2018.

[2] Excludes executives appointed since 2017 season.

Latest Industry News, Views & Information

How the SEC’s new proxy voting rules will impact executive compensation

There are many software applications and tools now available to support compensation decisions, but what should be taken into consideration before purchasing? This 5-minute guide details what Compensation Committees, Heads of Reward and Compensation Professionals should take into account when selecting software and tools for Say-on-Pay decisions.

S&P 500 Banking Industry’s Response to COVID-19

CGLytics examines how S&P 500 banks responded to the volatility of the pandemic prior to the Fed’s announcement to cap bank dividends and prohibit share repurchases until Q4 following its annual stress test of banks.

How to independently and efficiently benchmark executive compensation for Say-on-Pay

There are many software applications and tools now available to support compensation decisions, but what should be taken into consideration before purchasing? This 5-minute guide details what Compensation Committees, Heads of Reward and Compensation Professionals should take into account when selecting software and tools for Say-on-Pay decisions.

The EU Shareholder Rights Directive: The implications for executive compensation in Belgium and Luxembourg

The corporate governance landscape is changing. Listed EU companies are increasingly subject to more disclosure and transparency requirements while executive compensation is now under greater scrutiny than ever. In this article CGLytics takes a look at the implications of the EU Shareholder Rights Directive on executive compensation in Belgium and Luxembourg

The corporate governance landscape is changing. Listed EU companies are increasingly subject to more disclosure and transparency requirements while executive compensation is now under greater scrutiny than ever. Part of the call for greater transparency applies to the compensation of top executives of listed companies. Shareholders now have the right to an extended say on pay under the Revised Shareholders’ Rights Directive (SRD II) through their votes on the remuneration policy and report.

The EU SRD II: It’s Main Purpose

  1. To encourage long-term shareholder engagement by facilitating the exercise of shareholder rights
  2. To enhance transparency
  3. To increase directors’ accountability and reinforce the link between pay and company directors’ performance

Impact for companies

Under SRD II – Extension of shareholders’ right to say on pay

The SRD II requires the compensation of all directors to be reported on an individual basis. This will impact Belgium listed companies as previously it was deemed sufficient to provide this information on an aggregated basis.

Another change is the impact of shareholders’ votes on the remuneration policy, empowering them to oversee and influence directors’ remuneration. The shareholders’ vote on the remuneration report is not new, however, the content of the remuneration report will have to be more extensive and explicit to comply with SRD II. In particular, next year’s report will have to explain how the shareholders’ vote on the remuneration report was taken into account.

The most innovative change is the requirement to explain the changes in directors’ pay in relation to the evolution of the company’s performance and employees’ average pay during the period under examination. This will put the emphasis on the compensation committee to provide increasingly data driven analysis against a variety to financial and non-financial KPIs.

In the future – Disclosure of the CEO pay ratio?

The CEO pay ratio is the indicator of CEO compensation compared with employees’ pay, usually expressed by a multiple of the median annual salary of the employees of the company concerned. Currently, the pay ratio is not part of the disclosure requirements under European corporate governance regulations, in contrast with the US and the UK.

In the US for example, public companies are required to disclose the ratio of CEO pay to median employee pay in their proxy statement. In the UK, listed companies with more than 250 employees are required to disclose the ratio of their CEO’s total remuneration to the median (50th), 25th and 75th percentile full-time equivalent remuneration of their UK employees.

The future will tell us whether the disclosure of CEO pay ratios affects companies’ executive compensation practices. It cannot be ruled out that other governments will follow the path taken by the US and the UK in order to manage the perception of executive remuneration being increasingly out of step with the average employee pay.

Fair pay

Fairness in pay is not only about being transparent on the remuneration and the wage gap between CEOs/executives and employees. Fair pay also means non-discrimination between employees.

Significant developments are occurring worldwide regarding gender discrimination. Measures adopted to tackle this issue vary from country to country. Such measures may consist of transparency requirements (e.g. in Germany), the obligation to report on the gender pay gap in the company’s annual report (e.g. in the UK), the requirement to have a gender pay gap analysis conducted by independent and external bodies (e.g. in Switzerland) or mandatory equal pay certification (e.g. in Iceland – such legislation is under discussion in the Netherlands).

In Belgium, equal treatment is enshrined in the Belgian Constitution and in the Non-Discrimination Act, which prohibits any direct or indirect discrimination based on certain grounds, including in employment relations. Under the Gender Non-Discrimination Act, companies employing at least 50 employees are required to conduct a detailed analysis of their remuneration structure – to ensure a gender-neutral remuneration policy – every two years and deliver their report to the employee representative body.

To date, Belgian companies are not required to disclose their gender pay gap in their annual report or in their remuneration policies or report. Nevertheless, the information contained in the company’s social balance sheet must be broken down by gender. In addition, listed companies are required to describe their diversity policy in their Corporate Governance Statement.

In Luxembourg, labour law prohibits companies from using criteria other than knowledge, experience and responsibilities to determine remuneration. Despite initiatives of the Ministry of Equal Opportunities to raise awareness on the gender pay gap, no further legal provisions exist on this matter.

To this end, companies in Belgium and Luxembourg will be required to show greater transparency of executive and director pay, not just in comparison against the performance of the organisation, but also ensuring that it is benchmarked against the growth (or decline) of the average employee. Shareholders will have more information and greater powers to curtail excess pay, while holding companies to account against more financial and non-financial KPIs.

Take a deeper dive into executive compensation practices

With a wealth of global data, analytics and insights, review executive pay against an array of key financial indicators.

Replicate the peer groups of leading proxy advisors and investors, and instantly compare CEO pay against company performance and their peers.

Click here to download the Corporate Governance and Executive Pay: Legislative landscape and market insights report, produced together with PwC.

REQUEST A DEMO

Latest Industry News, Views & Information

Understanding ESG & Annual Incentive Plan

Understanding ESG & Annual Incentive Plan ESG refers to a series of environmental, social and governance criteria taken into consideration by the funds during the investing process. Investing in ESG funds allows shareholders to support companies in transition, that wish to act and develop in a more sustainable and responsible manner. In practice, many indicators … Continue reading “Understanding ESG & Annual Incentive Plan”

Pay for Performance: The Largest Institutional Investors’ View

Pay for Performance: The Largest Institutional Investors’ View   Executive compensation has been one of the trickiest issues within the corporate governance space as of late. Across the board, there seems to be no end in sight to finding the perfect compensation package or philosophy for corporate executives. In this article, we will discuss the … Continue reading “Pay for Performance: The Largest Institutional Investors’ View”

How to design your peer group for compensation benchmarking

How to design your peer group for compensation benchmarking   Given the scrutiny on executive compensation in recent years, it is critical to make sure that your company’s executive pay reflects its performance and aligns with the market. Therefore, it is essential for companies to have an appropriate peer group for performance benchmarking, compensation program … Continue reading "How to design your peer group for compensation benchmarking"

Gender Diversity In Australia

CGLytics explores boardroom gender diversity in Australia, with a particular focus on the upcoming ASX diversity targets.

The benefits of diverse leadership teams are gaining traction in the business world. There have been an increasing number of studies surrounding the debate whether a leadership team with gender diversity has a tendency to yield higher profits for companies.

In this paper, CGLytics explores boardroom gender diversity in Australia, with a particular focus on the upcoming ASX diversity targets.

Key takeaways

  • Australia is far from reaching the ASX Code target – companies are lagging well behind the target of 30% of female board members by January 1st 2020.
  • Women comprise less than 15% of all CEO and chair positions
  • The Issue of Overboarding – 69.7% of women hold more than four board positions, demonstrating a need to develop new candidates and look outside exisiting networks.

Investors expect companies to embrace change and respond to their proscriptions with regards to gender diversity. There exists a sense of urgency for Australian companies to address the issue of gender diversity, as this trend will likely expand in scope to include other areas such as ethnicity and age.

Download Now: Gender Diversity In Australia

Dive into Relationship Mapping With CGLytics

In order to widen the pool of candidates so boards can hit targets for skills and diversity, nominations and governance committees need to make use of data driven tools.

The CGLytics tool for Nominations and Governance committees gives boards access to over 125,000 director profiles, filterable by age, gender, skills and experience.

Learn more

Latest Industry News, Views & Information

  • All
  • Blog

Understanding ESG & Annual Incentive Plan

Understanding ESG & Annual Incentive Plan ESG refers to a series of environmental, social and governance criteria taken into consideration by the funds during the investing process. Investing in ESG funds allows shareholders to support companies in transition, that wish to act and develop in a more sustainable and responsible manner. In practice, many indicators … Continue reading “Understanding ESG & Annual Incentive Plan”

Pay for Performance: The Largest Institutional Investors’ View

Pay for Performance: The Largest Institutional Investors’ View   Executive compensation has been one of the trickiest issues within the corporate governance space as of late. Across the board, there seems to be no end in sight to finding the perfect compensation package or philosophy for corporate executives. In this article, we will discuss the … Continue reading “Pay for Performance: The Largest Institutional Investors’ View”

How to design your peer group for compensation benchmarking

How to design your peer group for compensation benchmarking   Given the scrutiny on executive compensation in recent years, it is critical to make sure that your company’s executive pay reflects its performance and aligns with the market. Therefore, it is essential for companies to have an appropriate peer group for performance benchmarking, compensation program … Continue reading "How to design your peer group for compensation benchmarking"

Waivers Of Mandatory Retirement Ages And Company Performance

CGLytics examines the costs and benefits of waiving the mandatory retirement age for directors, elaborating upon aspects of the S&P 500: Increasing Boardroom Diversity Report.

In today’s competitive corporate landscape, a company’s board refreshment policy should aim to ensure that board agendas are robustly debated with a variety of perspectives present. This multitude of perspectives as an integral part of the organisation’s decision-making bodies has often been termed “cognitive diversity”.

This article seeks to further elaborate upon certain aspects of CGLytics’ S&P 500: Increasing Boardroom Diversity Report, with a particular focus on age diversity within the boardroom, and examines the costs and benefits of waiving the mandatory retirement age for directors. The data included in this report is based on the same data set used in the publication, incorporating board composition data as of year end 2018.

Download Now: Mandatory Retirement Age – A Brief Overview

About the Author

Jaco Fourie: U.S. Research Analyst

Jaco holds a Bachelor of Science degree in Accounting and Finance from the University of Reading. He has gained experience as a research analyst from his enrollment at the Henley Business School and the International Capital Market Association Centre.

Latest Industry News, Views & Information

  • All
  • Blog

Understanding ESG & Annual Incentive Plan

Understanding ESG & Annual Incentive Plan ESG refers to a series of environmental, social and governance criteria taken into consideration by the funds during the investing process. Investing in ESG funds allows shareholders to support companies in transition, that wish to act and develop in a more sustainable and responsible manner. In practice, many indicators … Continue reading “Understanding ESG & Annual Incentive Plan”

Pay for Performance: The Largest Institutional Investors’ View

Pay for Performance: The Largest Institutional Investors’ View   Executive compensation has been one of the trickiest issues within the corporate governance space as of late. Across the board, there seems to be no end in sight to finding the perfect compensation package or philosophy for corporate executives. In this article, we will discuss the … Continue reading “Pay for Performance: The Largest Institutional Investors’ View”

How to design your peer group for compensation benchmarking

How to design your peer group for compensation benchmarking   Given the scrutiny on executive compensation in recent years, it is critical to make sure that your company’s executive pay reflects its performance and aligns with the market. Therefore, it is essential for companies to have an appropriate peer group for performance benchmarking, compensation program … Continue reading "How to design your peer group for compensation benchmarking"

Dominant themes from the 2018 AEX proxy season and what to expect in 2019

During the 2018 Dutch proxy season, shareholders actively engaged in a range of governance matters, with CEO remuneration remaining a key focus for stakeholders and widely publicised by the media. And, as always, the upcoming 2019 proxy season is likely to be influenced by happenings from the previous year.

During the 2018 Dutch proxy season, shareholders actively engaged in a range of governance matters, with CEO remuneration remaining a key focus for stakeholders and widely publicised by the media. And, as always, the upcoming 2019 proxy season is likely to be influenced by happenings from the previous year.

As it was the first year that Dutch companies had to comply with the revised Dutch Corporate Governance Code 2016, long-term value creation and CEO-to-average employee pay ratios were reported and picked up by the media. Alignment between CEO pay and performance was again taken into account, and CGLytics’ AEX Proxy Review revealed 44% of companies showed a misalignment between CEO pay and performance over a one year period.

Key themes that dominated the 2018 proxy season that will again be in the spotlight in 2019:

Long-term value creation

Investors will be looking for transparency on how companies’ strategies support long-term value creation, including evaluating the merits of companies’ goals, the internal culture and how they plan to minimise exposure to governance risks.

CEO-to-employee pay ratios

As this became mandatory, companies methodology on measuring CEO-to-average-employee pay ratios varied widely, indicating a more uniformed reporting method is required for fair and accurate measurement. Companies that displayed a large gap were called out by the media in 2018, which should be a consideration for Dutch companies going forward. Companies should expect and be ready to disclose and discuss reported figures.

CEO pay for performance alignment

CGLytics Pay for Performance Study conducted on the AEX 25 companies revealed 44% of companies were misaligned over one year, and 38% were misaligned over a three-year basis. Although these numbers appear significant, it was perceived that there was improvement in the balancing of compensation of AEX CEO’s over the long-term.

The reporting of CEO pay for performance will continue to be a hot topic in the 2019 proxy season, and companies can expect pressure from media, public and shareholders if any extreme executive pay policies and practices are revealed.

Getting ready for the upcoming season

Boards need to be fully prepared to engage during the upcoming proxy season. They must be equally, if not better, informed as shareholders, so they can engage constructively and avoid any reputational risks. Having access to the same intelligence and benchmarking tools as proxy advisors and investors is imperative to prepare.

Click here to download your copy of the CGLytics’ 2018 AEX Proxy Review: Shining the light on pay practices

Aniel Mahabier

CGLytics

Latest Industry News, Views & Information

How the SEC’s new proxy voting rules will impact executive compensation

There are many software applications and tools now available to support compensation decisions, but what should be taken into consideration before purchasing? This 5-minute guide details what Compensation Committees, Heads of Reward and Compensation Professionals should take into account when selecting software and tools for Say-on-Pay decisions.

S&P 500 Banking Industry’s Response to COVID-19

CGLytics examines how S&P 500 banks responded to the volatility of the pandemic prior to the Fed’s announcement to cap bank dividends and prohibit share repurchases until Q4 following its annual stress test of banks.

How to independently and efficiently benchmark executive compensation for Say-on-Pay

There are many software applications and tools now available to support compensation decisions, but what should be taken into consideration before purchasing? This 5-minute guide details what Compensation Committees, Heads of Reward and Compensation Professionals should take into account when selecting software and tools for Say-on-Pay decisions.

AI in the Boardroom: Fantasy or Reality?

While the exact role of AI in the boardroom in up for debate, the question remains: has the Robo Director come of age?

Artificial intelligence (AI) is everywhere even as a member of the board of a private equity firm based in Hong Kong. While the exact role of AI in the boardroom is up for debate, the question remains: has the Robo Director come of age?

Enter the Robo Director

On the face of it, the case for an AI-based director is powerful: machines can pull together vast amounts of information and make decisions based on complex algorithms. Moreover, certain technological advancements have given certain algorithms the ability to learn: cognitive technologies – such as machine learning and deep learning – are becoming more reliable and accessible day by day.

However, even the smartest machines are only as clever as the data they have at their disposal. Although this may also be said of humans, in practice people have unique intuition that operates and combines old and new variables at a different level than machines are currently capable of. This capacity enables the human director, or an entire board of directors, to change direction more quickly than a machine can when faced with new, unforeseen situations. Machine learning is based on repeated behaviours to extract data and then create an output based on that data extraction. Regular corrections to the algorithm are made based on human interpretations of the output, increasing the algorithm’s output accuracy over time. Machine-learning however does not currently provide the capacity to solve new problems when externalities comes into play. Often we hear of great business decisions made on the fly based on instinct or business nous, which are uniquely human traits…so far.

AI as the Assistant

AI works best in situations where large volumes of data must be processed and the logic that drives predictions and decisions can be easily expressed. Just as doctors and other medical professionals harness the power of AI to make better diagnoses, AI can support boards to make better decisions. However, the quality of the data plays a critical role in the algorithm’s capacity to identify trends, as it is reliant on “five-star data” for optimal recommendations.

Corporate Governance

AI can now improve problem-solving by assessing governance risks on a macro-level, and subsequently analyse structural deficiencies in a company’s governance policies and practices when compared to its peers faster than previously possible. Parameters can be set and certain aspects of governance can become data-driven rather than model-driven. This means better decisions and, more importantly, fewer wrong decisions that could lead to reputational and financial risk.

Competitive Landscape

With access to large volumes of data, AI can be harnessed to position a company in its competitive landscape. Models and methods can be developed to pinpoint a company’s competitiveness against competitors and to assess its performance trajectory.

Decision-Support Tools

AI can facilitate better strategic decisions based on real-time data and advanced analytics. Customer marketing journeys can be mapped more accurately, generating more positive outcomes. With better information at their disposal the board can focus on strategy rather than operations.

Unalterable Past, Perfidious Future

In business, many decisions are made using a combination of historical data, modelling and conjecture. But the truth is that the business environment is inherently uncertain: there are no control experiments or reruns. What worked in the past might not necessarily work in future, as evidenced in the classic case of the failure of the firm Long Term Capital Management. However, AI programs and technologies, when supplemented by governance data of the highest quality, can augment a board’s decision-making.

Getting ready for the boardroom of the future

Boards need to be fully prepared with the latest information and insights to make the right decisions, which support their long-term strategy. CGLytics has the deepest global governance data set in the market to date, and if combined with AI, the potential opportunities for boardroom intelligence really are endless.

Jonathan Nelson

CGLytics

Latest Industry News, Views & Information

How the SEC’s new proxy voting rules will impact executive compensation

There are many software applications and tools now available to support compensation decisions, but what should be taken into consideration before purchasing? This 5-minute guide details what Compensation Committees, Heads of Reward and Compensation Professionals should take into account when selecting software and tools for Say-on-Pay decisions.

How to independently and efficiently benchmark executive compensation for Say-on-Pay

There are many software applications and tools now available to support compensation decisions, but what should be taken into consideration before purchasing? This 5-minute guide details what Compensation Committees, Heads of Reward and Compensation Professionals should take into account when selecting software and tools for Say-on-Pay decisions.

How to independently and efficiently benchmark executive remuneration for Say-on-Pay

There are many software applications and tools now available to support remuneration decisions, but what should be taken into consideration before purchasing? This 5-minute guide details what Remuneration Committees, Heads of Reward and Compensation Professionals should take into account when selecting software and tools for remuneration decisions.